What is Technical Analysis?
Technical Analysis (TA) is a market analysis strategy that can be used in order to assist traders in identify potential trading opportunities. A trader utilizing TA strategies will typically analyze statistical trends gathered from historical asset prices.
Chart Indicators
Chart indicators are a specific subset of TA used for performing market analysis. Chart indicators can be applied to price charts and provide traders with additional data used to make trading decisions.
There are thousands of chart indicators available which use a variety of data in order to give traders insights into future price movements. The Ookiversity chart indicator series will focus on some of the more popular indicators.
In this week's article we are focusing on Bollinger Bands.
Bollinger Bands
Bollinger Bands, conceptualized and introduced by John Bollinger in the 1980s, are a set of trading bands that encapsulate price action on a chart. They consist of three lines:
- The Middle Band: This is a simple moving average (typically over 20 periods) of closing prices.
- The Upper Band: Situated two standard deviations above the middle band.
- The Lower Band: Positioned two standard deviations below the middle band.
The bands dynamically widen during periods of price volatility and contract during more tranquil times. The width of the bands, called the "Bandwidth," provides a relative definition of high and low, as it represents the standard deviation which measures volatility
How are Bollinger Bands used in Trading Strategies
Bollinger Bands are versatile tools that can be used to devise a multitude of trading strategies. Some of the most popular methods include:
- Bollinger Bounce: Prices tend to revert to the mean in ranging markets. When the price hits the upper band, traders consider it as overbought and anticipate a move back to the middle band. Conversely, when it touches the lower band, the asset might be seen as oversold.
- Bollinger Squeeze: A squeeze is a period when the bands come close together, indicating decreased volatility. It often precedes sudden volatility expansions, signifying potential breakouts. Traders look for periods of band constriction and prepare for forthcoming price movements.
- Walking the Bands: In a strong trending market, prices often "walk the band." In an uptrend, the price might hug the upper band, signaling continued strength. In downtrends, the converse is true, with prices clinging to the lower band.
- Band Breakout and Reversion: After a breakout from the bands, if the price reverts to touch the band again and bounces, it often confirms the breakout's authenticity and indicates the continuation of the trend.
- Volume Confirmation: To add more concreteness to Bollinger signals, traders often combine band movements with volume. For instance, a band breakout on increasing volume might be considered more valid than one with decreasing or stagnant volume.
Bollinger Bands and Ooki
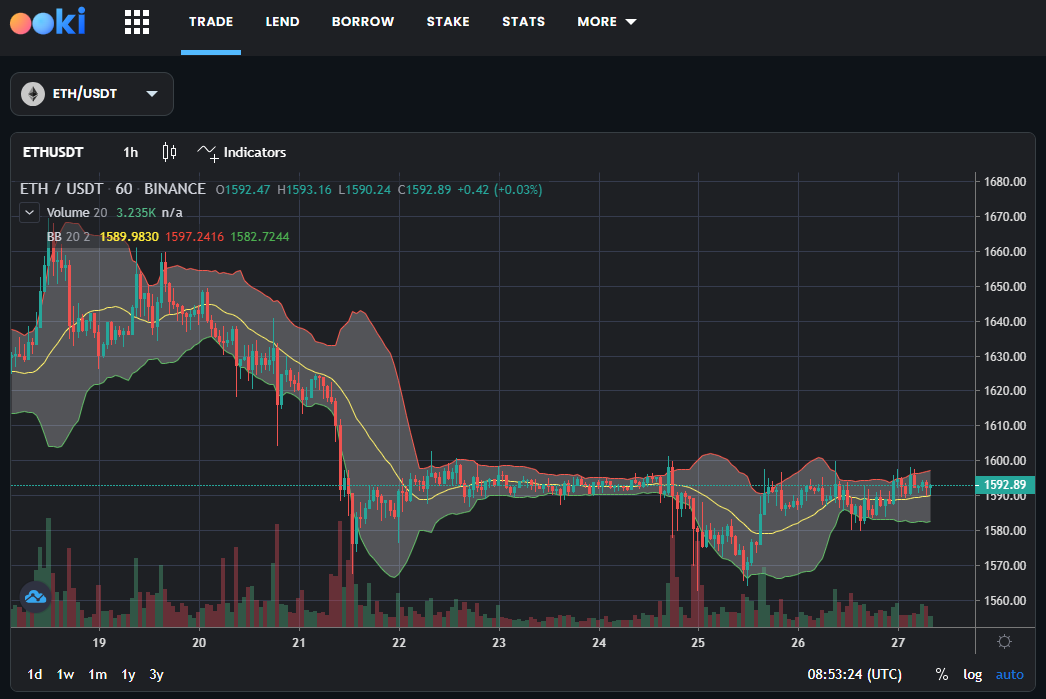
You can also use Bollinger Bands on Ooki. Just click on "Indicators" in the chart, type "Bollinger Bands" in the search box and select the indicator.
Conclusion
Indicators can help by using historical data to reflect the current state. This can be used to draw conclusions about possible future movements.
Indicators alone, however, are largely useless. In principle, other techniques should also be included in trading, such as candlestick analysis.
About Ooki
Ooki is a protocol for margin trading, borrowing, lending and staking enabling the building of Decentralized Applications for lenders, borrowers, and traders to interact with the most flexible decentralized finance protocol on multiple blockchains. Ooki is a fully decentralized, community-run DAO, governed by the community vote for all major changes to the protocol. Ooki users can engage in margin trading with up to 15x leverage using a fully decentralized trading platform.