What is Technical Analysis?
Technical Analysis (TA) is a market analysis strategy that can be used in order to assist traders in identify potential trading opportunities. A trader utilizing TA strategies will typically analyze statistical trends gathered from historical asset prices.
Chart Indicators
Chart indicators are a specific subset of TA used for performing market analysis. Chart indicators can be applied to price charts and provide traders with additional data used to make trading decisions.
There are thousands of chart indicators available which use a variety of data in order to give traders insights into future price movements. The Ookiversity chart indicator series will focus on some of the more popular indicators. In this weeks article we are focusing on Moving Averages.
Moving Averages
Moving Averages are lagging technical indicators that can be used for a variety of trading purposes. For example, moving averages can be used as entry or exit points for trades, and they can be used as potential zones of support or resistance.
Moving averages can also be used to identify ongoing price trends. Moving assist in identifying ongoing trends by smoothing out price data. Moving Averages can be calculated in a number of different ways. Three popular variations of moving averages are:
- Simple Moving Average (SMA): A simple moving average (SMA), is calculated by taking the arithmetic mean of a given set of values over a specified period of time. In other words, a set of numbers–or prices in the case of financial instruments–are added together and then divided by the number of prices in the set.
- Exponential Moving Average (EMA): The exponential moving average is a type of moving average that gives more weight to recent prices in an attempt to make it more responsive to new information.
- Weighted Moving Average (WMA): A Weighted Moving Average puts more weight on recent data and less on past data. This is done by multiplying each bar’s price by a weighting factor.
Moving Average Periods
Moving averages can be configured in an infinite number time frames. However the most effective time frames are those with the highest predictive ability. Typically, the most popular time frames chosen are: 15, 20, 30, 50, 100, and 200 days. The shorter the time span used to create the average, the more sensitive it will be to price changes. The longer the time span, the less sensitive the average will be.
How are Moving Averages used in Trading Strategies
Moving averages can be used in a vast number of trading strategies. Below are a few popular ways they can be utilized.
Moving averages provide a basis for identifying uptrends or downtrends:
- An uptrend (bullish) occurs when the asset price moves above the moving average
- A downtrend (bearish) refers to a price lower than the moving average

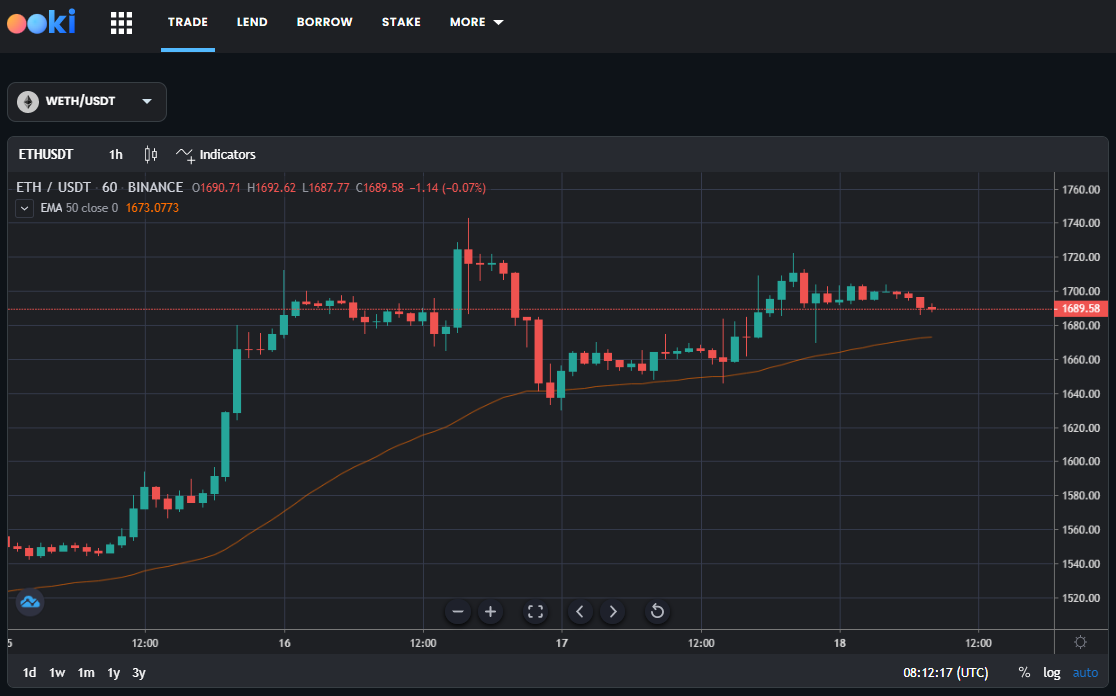
Exponential Moving Average (EMA)
EMA is a moving average that emphasizes recent data points, making data highly responsive to new information. It provides a crucial resource, confirming and validating significant market movements when synergized with other technical parameters.
Popular exponential moving averages are 12- and 26-day EMAs for short-term averages, whereas the 50- and 200-day EMAs pivotal as long-term trend indicators. EMA signals can be bullish or bearish depending on the data.