What is Technical Analysis?
Technical Analysis (TA) is a market analysis strategy that can be used in order to assist traders in identify potential trading opportunities. A trader utilizing TA strategies will typically analyze statistical trends gathered from historical asset prices.
Chart Indicators
Chart indicators are a specific subset of TA used for performing market analysis. Chart indicators can be applied to price charts and provide traders with additional data used to make trading decisions.
There are thousands of chart indicators available which use a variety of data in order to give traders insights into future price movements. The Ookiversity chart indicator series will focus on some of the more popular indicators.
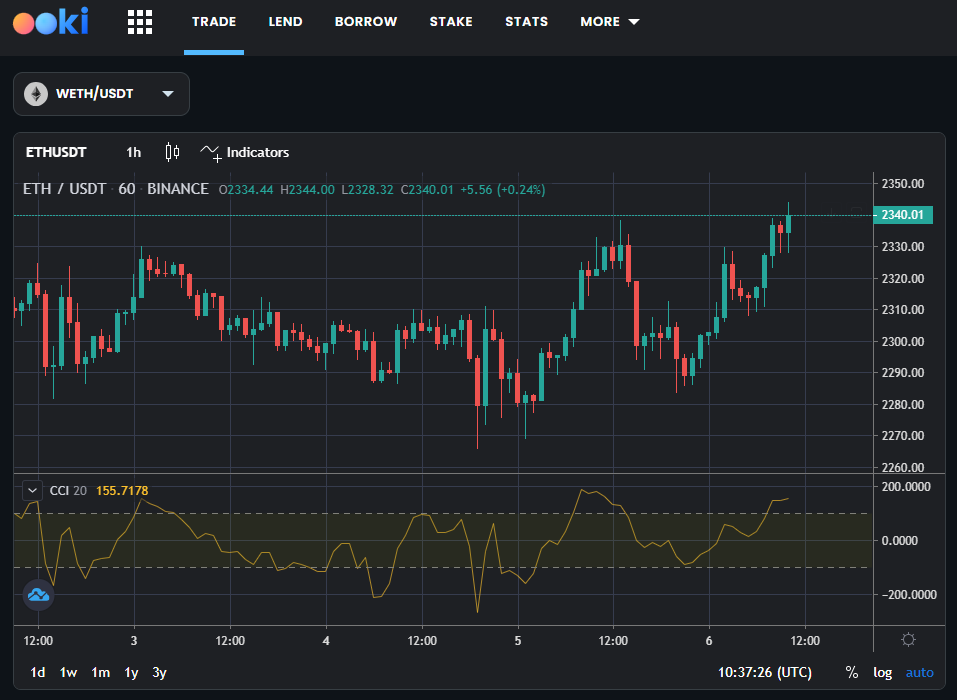
In this week's article we are focusing on Commodity Channel Index (CCI).
Commodity Channel Index (CCI)
The Commodity Channel Index (CCI) is a versatile technical analysis indicator used to identify new trends or warn of extreme conditions. Developed by Donald Lambert in 1980, the CCI compares the current price to an average price over a specific period. While initially designed for commodities, it is now applied across various asset classes, including stocks and currencies.
The CCI oscillates above and below zero, typically moving between +100 and -100. Values above +100 suggest that the price is well above the historical average, indicating overbought conditions or the start of a new uptrend. Conversely, values below -100 may signal oversold conditions or the beginning of a new downtrend. Traders use these levels to gauge market momentum and potential price reversals.
How to Use CCI in Trading Strategies
Incorporating the CCI into trading strategies can enhance market analysis and decision-making:
- Identifying Overbought and Oversold Conditions: CCI readings above +100 can indicate overbought conditions, suggesting a price pullback or trend reversal might be imminent. Similarly, readings below -100 indicate oversold conditions, potentially heralding an upward price correction or trend change.
- Spotting New Trends: A sustained move beyond the +100 or -100 thresholds can signal the start of a new trend. Traders might enter trades in the direction of the CCI breakout to capitalize on early trend formation.
- Divergence: Divergence between the CCI and price action can be a powerful signal. For instance, if the price hits a new high but the CCI does not, it may suggest weakening momentum and an upcoming trend reversal.
- Zero Line Crossovers: Movements of the CCI across the zero line can also indicate short-term changes in momentum, offering traders opportunities for quick trades based on the shifting trend strength.
The CCI is a dynamic tool that, when used judiciously, can offer valuable insights into market conditions, helping traders identify potential entry and exit points based on momentum and trend strength. As with all indicators, the CCI should be used in conjunction with other analysis methods to confirm trading signals.
Indicators alone, however, are largely useless. In principle, other techniques should also be included in trading, such as candlestick and chart pattern analysis.
About Ooki
Ooki is a protocol for margin trading, borrowing, lending and staking enabling the building of Decentralized Applications for lenders, borrowers, and traders to interact with the most flexible decentralized finance protocol on multiple blockchains. Ooki is a fully decentralized, community-run DAO, governed by the community vote for all major changes to the protocol. Ooki users can engage in margin trading with up to 15x leverage using a fully decentralized trading platform.