What is Technical Analysis?
Technical Analysis (TA) is a strategic approach to market analysis, aiding traders and investors in identifying potential trading and investment opportunities. It involves the study of historical market data, primarily price and volume, to forecast future market behavior.
Chart Indicators
Chart indicators are a specific subset of TA used for performing market analysis. Chart indicators can be applied to price charts and provide traders with additional data used to make trading decisions.
There are thousands of chart indicators available which use a variety of data in order to give traders insights into future price movements. The Ookiversity chart indicator series will focus on some of the more popular indicators.
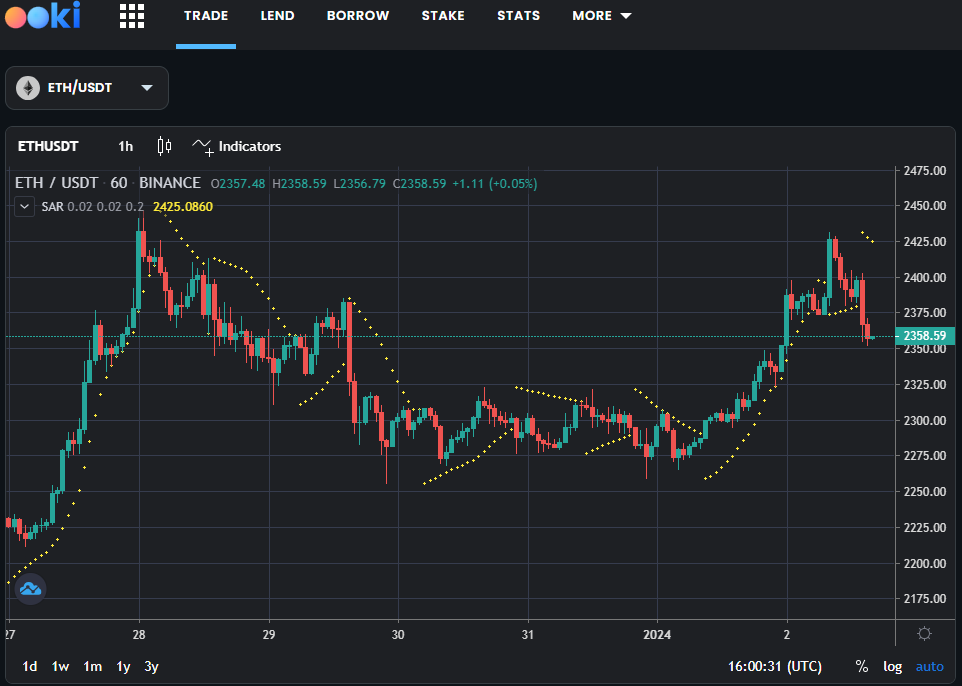
In this week's article we are focusing on Parabolic SAR.
Parabolic SAR
The Parabolic SAR (Stop and Reverse) is a trading indicator revered for its effectiveness in determining the momentum direction of an asset. Developed by J. Welles Wilder Jr., who is also known for the Relative Strength Index (RSI), the Parabolic SAR is distinctive in its capability to provide clear entry and exit signals in a trending market.
Appearing as a series of dots placed either above or below the price bars on a chart, the Parabolic SAR helps to identify potential reversals in the market's price direction. When the dots are below the price bars, it signifies a bullish trend, and traders might consider it an opportunity to buy or stay long. Conversely, when the dots are above the price bars, it suggests a bearish trend, signaling an opportunity to sell or short.
The "SAR" in Parabolic SAR stands for "stop and reverse," indicating that this indicator is not just for spotting trends but also for suggesting when a current trend could be ending. The system can potentially provide traders with information on where to place stop-loss orders. As the price moves, the SAR dots follow, either accelerating with the trend or trailing closer to the price action as it slows down, thus the term 'parabolic,' referring to the shape that the indicator can form on a chart.
How to Use Parabolic SAR in Trading Strategies
The Parabolic SAR can be a pivotal tool in a trader's strategy, particularly when dealing with strong trends. Here are ways to incorporate it:
- Trend Confirmation: The Parabolic SAR can confirm the direction of a market's trend. A series of rising dots below the price bars confirms an uptrend, while descending dots above the price bars indicate a downtrend.
- Setting Stop-Loss Orders: A common use of the Parabolic SAR is in setting trailing stop-loss orders. Traders can adjust their stop-loss to the level of the SAR dot, which moves with the price, allowing them to secure profits or limit losses as the market moves.
- Timing Entries and Exits: The indicator is particularly useful for timing exits during a trade. When the dots flip to the opposite side of the price, it suggests that the trend might be reversing, which can be a signal to exit a trade.
- Filtering Signals: In markets with less pronounced trends, the Parabolic SAR may produce false signals. Therefore, it is often used in conjunction with other indicators, such as moving averages or the ADX, to filter these signals and improve accuracy.
In summary, the Parabolic SAR is an intuitive and dynamic indicator that provides valuable insights into market momentum and potential trend reversals. Its straightforward mechanism of trailing stop points offers a methodical approach to capturing trends and managing trades. However, traders should use it judiciously, especially in sideways markets where its effectiveness can diminish.
Use the Ookiversity to learn more about indicators and trading tools.
About Ooki
Ooki is a protocol for margin trading, borrowing, lending and staking enabling the building of Decentralized Applications for lenders, borrowers, and traders to interact with the most flexible decentralized finance protocol on multiple blockchains. Ooki is a fully decentralized, community-run DAO, governed by the community vote for all major changes to the protocol. Ooki users can engage in margin trading with up to 15x leverage using a fully decentralized trading platform.