What is Technical Analysis?
Technical Analysis (TA) is a market analysis strategy that can be used in order to assist traders in identify potential trading opportunities. A trader utilizing TA strategies will typically analyze statistical trends gathered from historical asset prices.
Chart Indicators
Chart indicators are a specific subset of TA used for performing market analysis. Chart indicators can be applied to price charts and provide traders with additional data used to make trading decisions.
There are thousands of chart indicators available which use a variety of data in order to give traders insights into future price movements. The Ookiversity chart indicator series will focus on some of the more popular indicators.
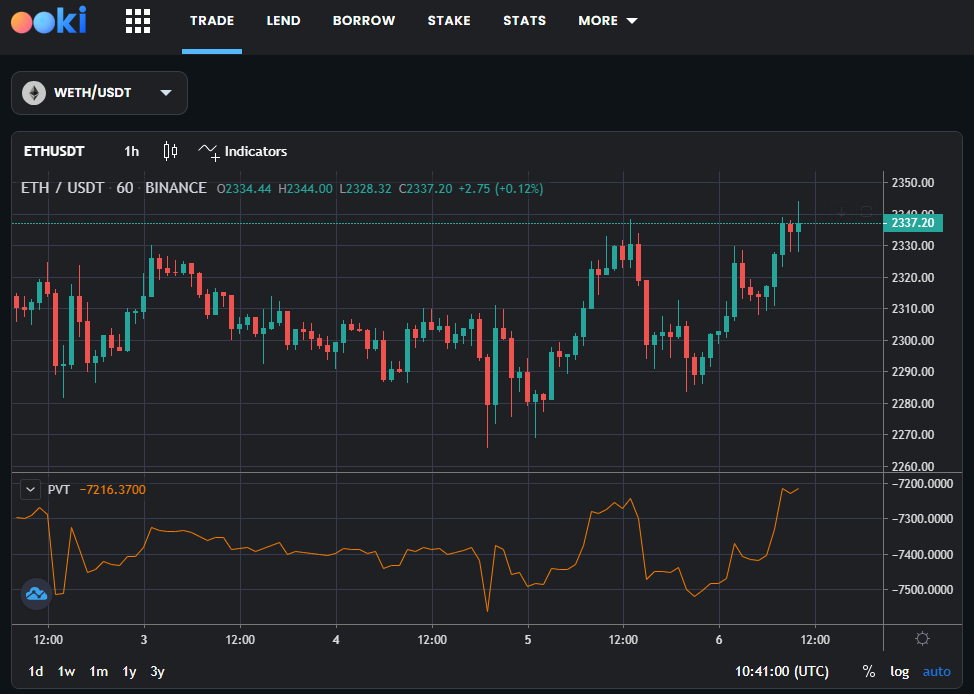
In this week's article we are focusing on Price Volume Trend (PVT).
Price Volume Trend (PVT)
The Price Volume Trend (PVT) indicator combines price and volume to give investors a cumulative line that helps to identify the direction of the trend and the strength of price movements. Similar to the On-Balance Volume (OBV) indicator, PVT integrates volume with the asset's price change to provide a signal of the underlying momentum and confirm price trends.
The calculation of PVT involves adding or subtracting a percentage change in price multiplied by the volume of the current day to the previous day's PVT value. This results in a cumulative line that moves with price changes and volume. When the PVT line is rising, it suggests that buyers are in control, indicating bullish momentum. Conversely, a declining PVT line signals that sellers are dominating, reflecting bearish momentum.
How to Use Price Volume Trend in Trading Strategies
Incorporating PVT into trading strategies offers a nuanced approach to understanding market dynamics. Here’s how:
- Trend Confirmation: PVT can be used to confirm the presence of a trend. An increasing PVT line in conjunction with rising prices suggests a strong uptrend, while a decreasing PVT line alongside falling prices indicates a strong downtrend.
- Divergence: Divergence between the PVT line and price action can signal potential reversals. If the price is making new highs while PVT is failing to do so, it may indicate weakening momentum and a possible bearish reversal. Similarly, if the price is making new lows but PVT is not, it could signal a bullish reversal.
- Volume Analysis: Since PVT incorporates volume, it provides insights into the strength behind price movements. Rising volume and price with an ascending PVT suggest a strong, supported trend.
PVT offers a comprehensive view by blending volume data with price trends, aiding traders in decision-making by confirming trend strength and spotting potential reversals. It's a valuable tool for enhancing the analysis of market trends and momentum.
Indicators alone, however, are largely useless. In principle, other techniques should also be included in trading, such as candlestick and chart pattern analysis.
About Ooki
Ooki is a protocol for margin trading, borrowing, lending and staking enabling the building of Decentralized Applications for lenders, borrowers, and traders to interact with the most flexible decentralized finance protocol on multiple blockchains. Ooki is a fully decentralized, community-run DAO, governed by the community vote for all major changes to the protocol. Ooki users can engage in margin trading with up to 15x leverage using a fully decentralized trading platform.