

What is Technical Analysis?
Technical Analysis (TA) is a market analysis strategy that can be used in order to assist traders in identify potential trading opportunities. A trader utilizing TA strategies will typically analyze statistical trends gathered from historical asset prices.
Chart Indicators
Chart indicators are a specific subset of TA used for performing market analysis. Chart indicators can be applied to price charts and provide traders with additional data used to make trading decisions.
There are thousands of chart indicators available which use a variety of data in order to give traders insights into future price movements. The Ookiversity chart indicator series will focus on some of the more popular indicators.
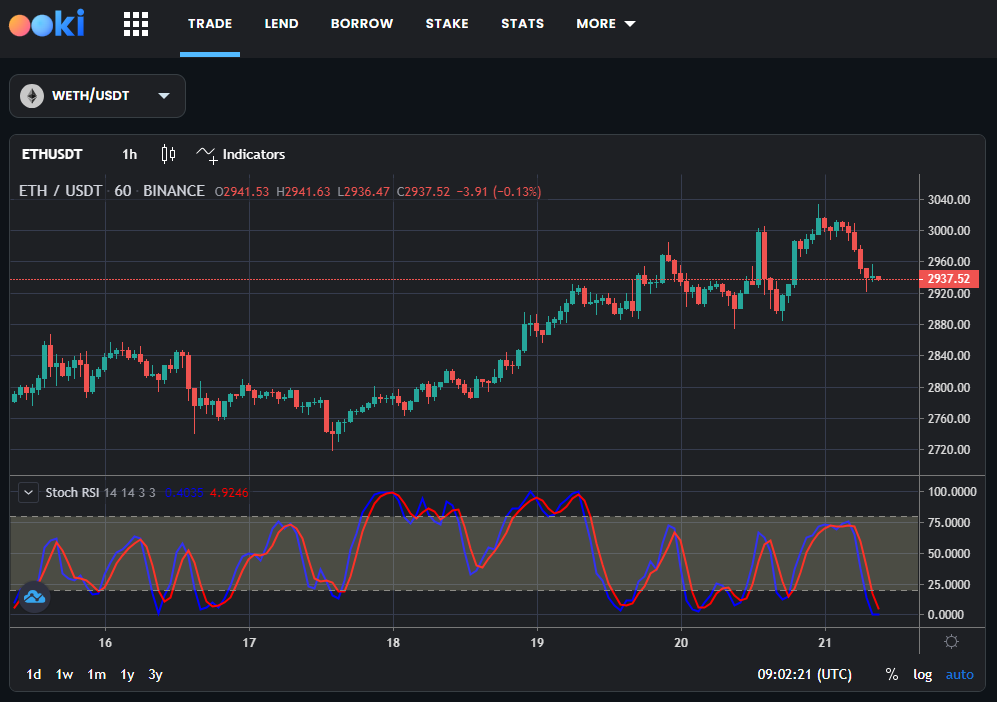
In this week's article we are focusing on Stochastic RSI.
Stochastic RSI
The Stochastic RSI (StochRSI) is an oscillator that measures the level of the Relative Strength Index (RSI) relative to its high-low range over a specified period. It is essentially an indicator of an indicator, designed to help identify RSI's overbought and oversold conditions more precisely. By applying the stochastic oscillator formula to the RSI, traders can pinpoint the RSI's current position relative to its recent range, enhancing the effectiveness of the RSI for trading decisions.
StochRSI values range between 0 and 1 (or 0 and 100, depending on the charting software). Readings close to 1 (or 100) indicate that the RSI is at the high end of its defined range, suggesting overbought conditions. Conversely, readings near 0 suggest oversold conditions. This makes the StochRSI a potent tool for identifying potential reversal points before they occur in the underlying price movement.
A key feature of the StochRSI is its two main components: the %K line (blue), which is the actual value of the StochRSI, and the %D line (red), a moving average of the %K line that serves as a signal line. The %K line tracks the RSI's momentum, while the %D line smoothens the %K line's fluctuations to highlight potential trend shifts.
How to Use Stochastic RSI in Trading Strategies
Incorporating the StochRSI into trading strategies involves understanding the interplay between the %K and %D lines:
- Overbought and Oversold Conditions: The StochRSI helps pinpoint precise overbought (>0.8 or 80) and oversold (<0.2 or 20) levels. These thresholds can guide traders on when to consider entering or exiting trades.
- %K and %D Line Crossovers: Crossovers of the %K and %D lines are critical signals. A crossover above the %D line by the %K line suggests bullish momentum, potentially indicating a buying opportunity. Conversely, a %K line crossing below the %D line can signal bearish momentum, hinting at a selling or shorting opportunity.
- Divergence: Observing divergences between the StochRSI and price action is crucial for spotting potential reversals. A divergence occurs when the price trends in one direction and the StochRSI trends in another, indicating weakening momentum and a possible price direction change.
- Combination with Other Indicators: For enhanced accuracy, traders often use the StochRSI alongside other indicators, such as moving averages or volume data. This multi-faceted approach helps confirm the signals provided by the StochRSI, reducing the likelihood of false positives.
The StochRSI, with its %K and %D lines, offers a refined perspective on market momentum and potential reversal points, making it an invaluable tool for traders aiming to optimize their entry and exit strategies. By understanding and applying the signals generated by the StochRSI, traders can make more informed decisions in fast-moving markets.
Indicators alone, however, are largely useless. In principle, other techniques should also be included in trading, such as candlestick and chart pattern analysis.
About Ooki
Ooki is a protocol for margin trading, borrowing, lending and staking enabling the building of Decentralized Applications for lenders, borrowers, and traders to interact with the most flexible decentralized finance protocol on multiple blockchains. Ooki is a fully decentralized, community-run DAO, governed by the community vote for all major changes to the protocol. Ooki users can engage in margin trading with up to 15x leverage using a fully decentralized trading platform.