
What is Technical Analysis?
Technical Analysis (TA) is a market analysis strategy that can be used in order to assist traders in identify potential trading opportunities. A trader utilizing TA strategies will typically analyze statistical trends gathered from historical asset prices.
Chart Indicators
Chart indicators are a specific subset of TA used for performing market analysis. Chart indicators can be applied to price charts and provide traders with additional data used to make trading decisions.
There are thousands of chart indicators available which use a variety of data in order to give traders insights into future price movements. The Ookiversity chart indicator series will focus on some of the more popular indicators.
In this week's article we are focusing on Volume Weighted Average Price (VWAP).
Volume Weighted Average Price (VWAP)
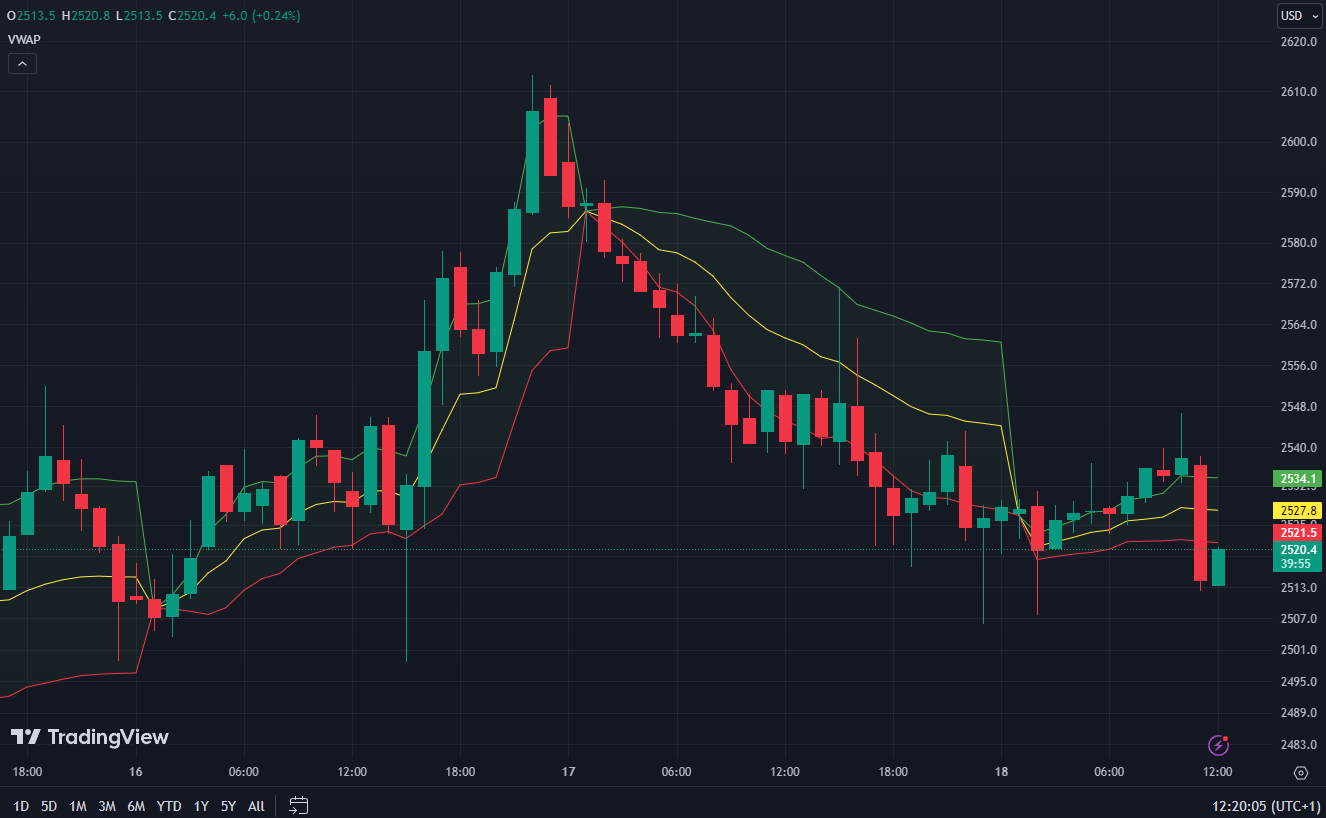
Volume Weighted Average Price (VWAP) is a trading benchmark commonly used by traders to gauge the market's trend and to make trade decisions. VWAP is calculated by taking the cumulative total of the product of the number of shares traded and the price, divided by the total shares traded for the day.
This indicator provides traders with insight into both the trend and the value of a security. A price above the VWAP line is typically considered bullish and may indicate a good time to buy, while a price below the VWAP line can be seen as bearish, suggesting a potential sell opportunity. VWAP is often used in algorithmic trading and by institutional traders to move into or out of stocks with as little market impact as possible.
How to Use VWAP in Trading Strategies
VWAP can be a powerful tool in a trader's arsenal. Here's how it can be integrated into trading strategies:
- Trend Identification: VWAP can help in determining the market trend. Prices above VWAP may indicate an uptrend, while prices below it suggest a downtrend.
- Trade Entry and Exit Points: Traders can use VWAP to identify potential entry and exit points. For example, buying near the VWAP in an uptrend or selling near the VWAP in a downtrend.
- Comparing Price Action: VWAP can be used to compare the price action of an asset to its average, giving traders a sense of whether a security is overvalued or undervalued.
- Combination with Other Indicators: VWAP is often used in conjunction with other indicators like moving averages or RSI for confirmation of trends or potential reversals.
Conclusion
In summary, VWAP is a versatile tool that not only gives an average price but also incorporates volume, making it a more comprehensive indicator. It is particularly useful in assessing whether a stock is overbought or oversold relative to its typical value.
Indicators alone, however, are largely useless. In principle, other techniques should also be included in trading, such as candlestick analysis.
About Ooki
Ooki is a protocol for margin trading, borrowing, lending and staking enabling the building of Decentralized Applications for lenders, borrowers, and traders to interact with the most flexible decentralized finance protocol on multiple blockchains. Ooki is a fully decentralized, community-run DAO, governed by the community vote for all major changes to the protocol. Ooki users can engage in margin trading with up to 15x leverage using a fully decentralized trading platform.