
What is Technical Analysis?
Technical Analysis (TA) is a market analysis strategy that can be used in order to assist traders in identify potential trading opportunities. A trader utilizing TA strategies will typically analyze statistical trends gathered from historical asset prices.
Chart Indicators
Chart indicators are a specific subset of TA used for performing market analysis. Chart indicators can be applied to price charts and provide traders with additional data used to make trading decisions.
There are thousands of chart indicators available which use a variety of data in order to give traders insights into future price movements. The Ookiversity chart indicator series will focus on some of the more popular indicators.
In this week's article we are focusing on Average Directional Index (ADX).
Average Directional Index (ADX)
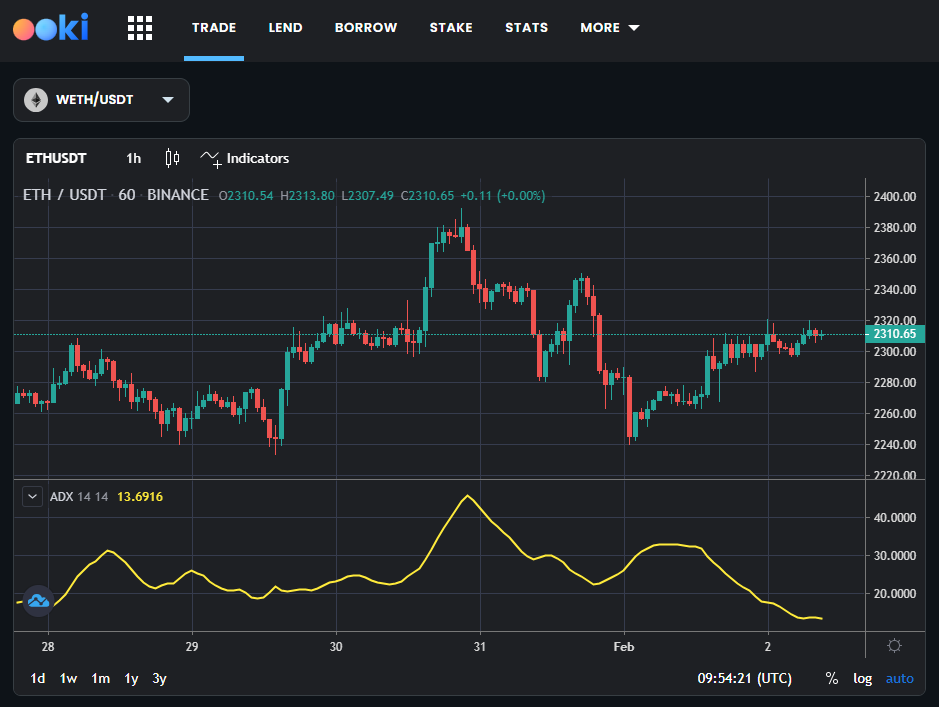
The Average Directional Index (ADX) is a technical analysis indicator used to quantify the strength of a trend. Developed by J. Welles Wilder Jr., the ADX is part of the Directional Movement System, which also includes the Positive Directional Indicator (+DI) and Negative Directional Indicator (-DI). The ADX itself does not indicate trend direction, but rather the momentum's strength, whether in a bullish or bearish market.
The ADX is displayed as a single line with values ranging from 0 to 100. Generally, a reading above 25 indicates a strong trend, while a reading below 20 suggests a weak trend or trading range. The indicator helps traders to distinguish between trending and range-bound conditions, aiming to enter trades during strong trends and avoid periods of market indecision.
How to Use ADX in Trading Strategies
The ADX can be a valuable component of a trading strategy by providing insight into the market's trend strength. Here's how traders can utilize the ADX:
- Trend Strength Assessment: A high ADX value signifies a strong trend, providing traders with the confidence to pursue trend-following strategies. Conversely, a low ADX value might indicate a pause or reversal of the current trend.
- Combining with +DI and -DI: To determine trend direction, traders often look at the +DI and -DI lines that accompany the ADX. A rising +DI above -DI can signal a bullish trend, while a rising -DI above +DI indicates a bearish trend.
- Identifying Trade Entry and Exit Points: Traders might consider entering a trade when the ADX starts to rise from below 20, suggesting that a trend is gaining strength. Exit signals could be based on the ADX peaking and then turning down, implying the trend's weakening.
- Filtering Trades: The ADX can help filter out trades in a weak or range-bound market, allowing traders to focus on stronger, more directional markets.
In conclusion, the ADX is a powerful tool for assessing trend strength and potential market direction when used in conjunction with the +DI and -DI indicators. It aids traders in making more informed decisions by highlighting periods of strong momentum and trend continuity.
Indicators alone, however, are largely useless. In principle, other techniques should also be included in trading, such as candlestick and chart pattern analysis.
About Ooki
Ooki is a protocol for margin trading, borrowing, lending and staking enabling the building of Decentralized Applications for lenders, borrowers, and traders to interact with the most flexible decentralized finance protocol on multiple blockchains. Ooki is a fully decentralized, community-run DAO, governed by the community vote for all major changes to the protocol. Ooki users can engage in margin trading with up to 15x leverage using a fully decentralized trading platform.