What is Technical Analysis?
Technical Analysis (TA) is a market analysis strategy that can be used in order to assist traders in identify potential trading opportunities. A trader utilizing TA strategies will typically analyze statistical trends gathered from historical asset prices.
Trading may be a lucrative endeavor, but to be successful, one must have a solid grasp of technical analysis. Knowing when to take profits is one of the most crucial components of trading. In this blog article, we will look at some popular chart indicators that can help you decide when to take profits.
Moving Averages
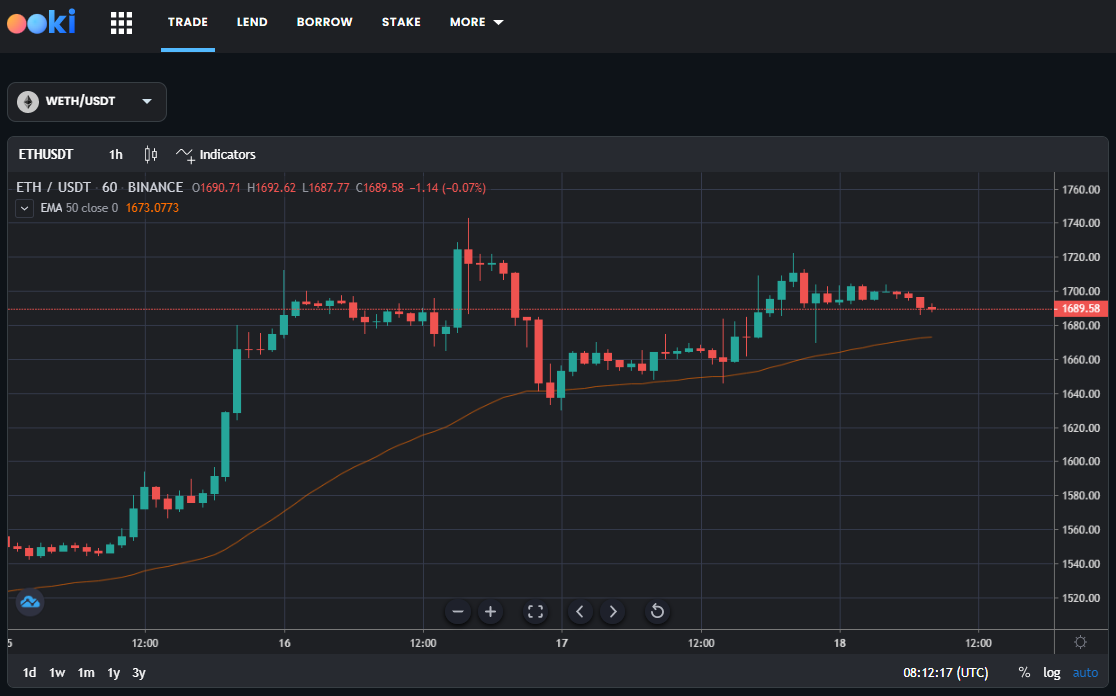
A common technical analysis tool for spotting trends and levels of support and resistance is the moving average. Simple moving averages (SMA) and exponential moving averages are the two primary forms of moving averages (EMA). SMAs equally weight each data point over the analysis period, but EMAs favor more recent data. Because of this, EMAs respond to recent price movements more quickly than SMAs.
You may use moving averages to pinpoint probable levels of support and resistance and determine the trend's direction. A negative indication is given when the price crosses below a moving average, while a bullish signal is given when the price passes above one. The 50-day and 200-day moving averages are frequently used by traders to spot long-term trends.
Relative Strength Index
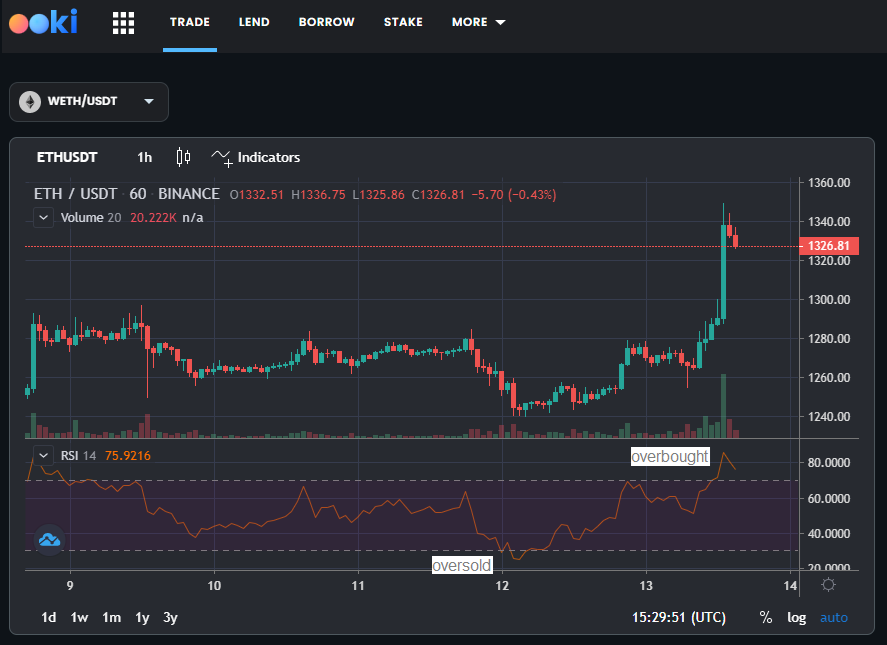
The relative strength index (RSI) is a momentum oscillator that gauges how quickly prices move and how they change over time. It ranges from 0 to 100 and is considered overbought above 70 and oversold below 30. When the RSI is in overbought territory, it may indicate that the asset is due for a pullback, while oversold RSI readings may signal a potential buying opportunity.
You may use the RSI to find instances where the price and the indicator diverge. When the price makes a lower low but the RSI makes a higher low, this is known as a bullish divergence. This might mean that the selling pressure is easing and a turn around could be right around the corner. When the price hits a higher high but the RSI hits a lower high, this is known as a bearish divergence. This can be a sign that the purchasing pressure is waning and a turn around could be right around the corner.
Bollinger Bands
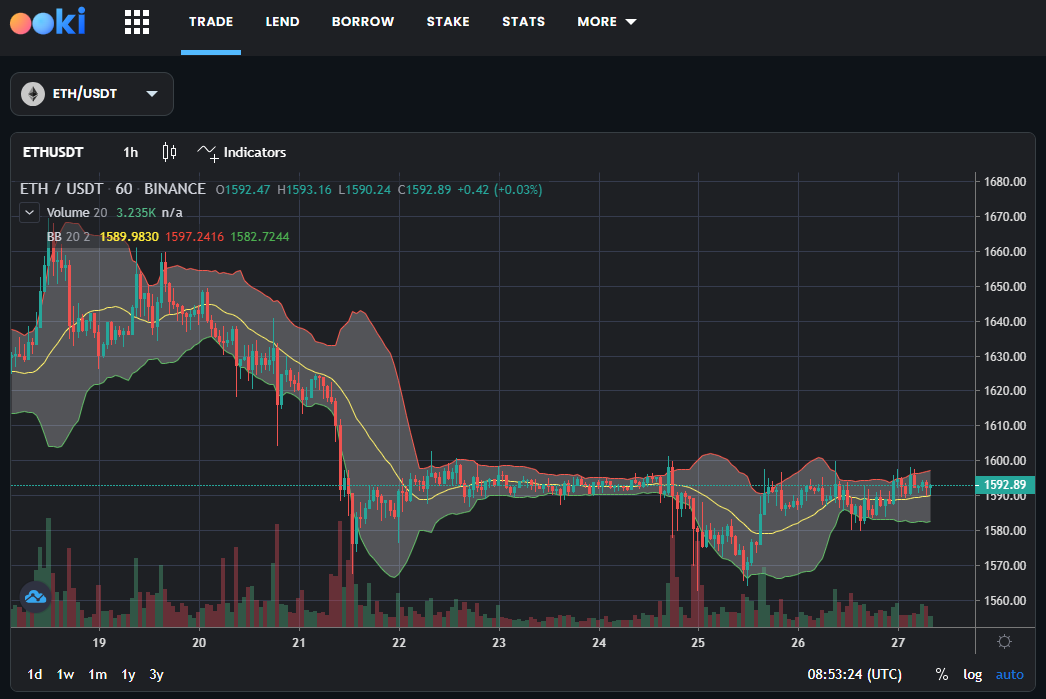
The moving average, an upper band, and a lower band are the three lines that make up the Bollinger Bands volatility indicator. A multiple of the standard deviation is added to and subtracted from the moving average to determine the upper and lower bands. How much the price has deviated from the moving average is indicated by the standard deviation.
You may use Bollinger Bands to spot overbought and oversold circumstances. While a contact of the lower band may imply oversold circumstances and a possible buying opportunity, a contact of the upper band may show that the asset is overbought and due for a pullback.
Take Profit Techniques
These indicators (there are many others, of course -> Ookiversity) may be used to develop a take profit plan once you have identified probable locations of support and resistance. For instance, you may choose to sell when the price approaches a significant moving average or when the RSI crosses the overbought line. When the price crosses the top band of the Bollinger Bands, you could also choose to take a profit. Or you can use different indicators and candlestick analysis which then confirm each other in the best case.
Either way, it's critical to establish and follow a clear plan. Emotional trading can result in erroneous judgment calls and potentially disastrous losses. You may eliminate emotion from trading by using these indicators to develop a take profit plan. This will allow you to make more rational choices.
About Ooki
Ooki is a protocol for margin trading, borrowing, lending and staking enabling the building of Decentralized Applications for lenders, borrowers, and traders to interact with the most flexible decentralized finance protocol on multiple blockchains. Ooki is a fully decentralized, community-run DAO, governed by the community vote for all major changes to the protocol. Ooki users can engage in margin trading with up to 15x leverage using a fully decentralized trading platform.