

What is Technical Analysis?
Technical Analysis (TA) is a market analysis strategy that can be used in order to assist traders in identify potential trading opportunities. A trader utilizing TA strategies will typically analyze statistical trends gathered from historical asset prices.
Chart Indicators
Chart indicators are a specific subset of TA used for performing market analysis. Chart indicators can be applied to price charts and provide traders with additional data used to make trading decisions.
There are thousands of chart indicators available which use a variety of data in order to give traders insights into future price movements. The Ookiversity chart indicator series will focus on some of the more popular indicators.
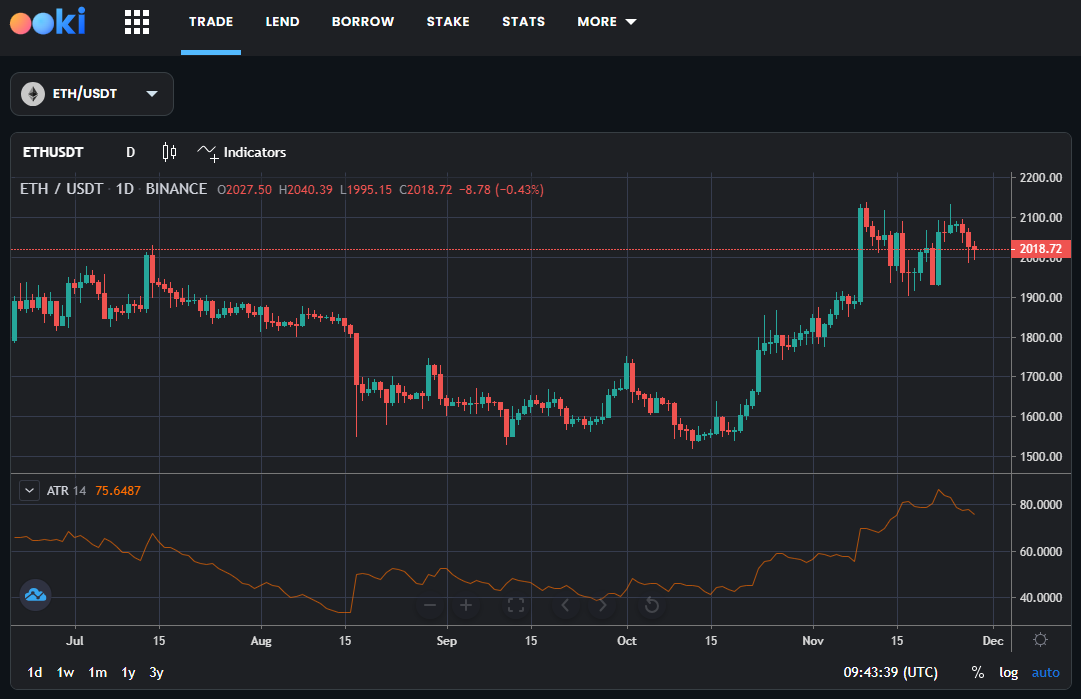
In this week's article we are focusing on Average True Range (ATR).
Average True Range (ATR)
The Average True Range (ATR) is a pivotal technical analysis tool, conceptualized by J. Welles Wilder Jr., a luminary in technical analysis. It's designed to measure market volatility by breaking down the full range of an asset's price over a specific period. The ATR's primary function is to gauge the intensity of price volatility by evaluating the entire price range of an asset within the chosen timeframe.
On trading charts, the ATR typically appears with a numerical scale. This scale varies, reflecting values such as 40 to 80, which indicate the ATR in points or pips. The scale's range can fluctuate based on the asset's inherent volatility and the specific preferences of the trader. To calculate the ATR, an average of the true ranges over a predefined number of trading days is taken. The true range is determined by identifying the greatest of these three values: the current high minus the current low, the absolute difference between the current high and the previous close, or the absolute difference between the current low and the previous close.
Unlike directional indicators like moving averages or the MACD, the ATR offers a statistical perspective of an asset's typical movement over a set period, often defaulting to a 14-day period, but adjustable to suit various timeframes. The ATR is depicted as a line on a chart, where higher values suggest increased volatility and lower values indicate less volatility. This variability is crucial for traders in understanding the extent of price movements or changes, providing insights essential for formulating effective trading strategies.
The ATR is especially useful in setting stop-loss orders and adjusting trade sizes, adapting to the asset's current volatility. For instance, a higher ATR value might prompt a trader to place wider stop-loss orders to accommodate increased price fluctuations. Conversely, a lower ATR could lead to tighter stop orders, reflecting a less volatile market.
How to Use ATR in Trading Strategies
Incorporating the Average True Range (ATR) into trading strategies offers traders a valuable tool for understanding market volatility. Here's a guide to effectively applying ATR:
- Introduction to Strategy Application: While the Average True Range (ATR) is a key tool in understanding market volatility, its real value comes into play when strategically applied in trading decisions. This revolves around using ATR to make informed choices about entry points, stop-loss orders, and assessing market momentum.
- Setting Stop-Loss Orders: A crucial application of ATR is in setting stop-loss orders. Traders often use a multiplier of the ATR to determine a safe distance for their stop-loss, ensuring it's not too tight or too wide. For instance, with an ATR of $2, using a 2x multiplier would place a stop-loss $4 away from the entry point. This method accommodates current market volatility, reducing the likelihood of premature stop-outs.
- Position Sizing: Position sizing can be adjusted based on the ATR value to maintain consistent risk levels. In more volatile markets, indicated by a higher ATR, traders may choose smaller positions to mitigate risk, and vice versa for less volatile markets.
- Identifying Entry and Exit Points: Though ATR doesn't predict market direction, it's useful in confirming trend strength. An increase in ATR following a breakout can reinforce the validity of the trend, while a decrease might suggest a weakening trend or a period of consolidation.
- Detecting Volatility Breakouts: Traders can also use ATR to spot volatility breakouts. A rapid increase in ATR after a period of low volatility often signals a potential breakout from a range, offering opportunities for entering new positions.
In conclusion, the ATR is a versatile and invaluable tool in a trader's arsenal, offering key insights into market volatility and assisting in making informed trading decisions. Its application across different timeframes and assets makes it a universally relevant indicator in various market conditions.
Use the Ookiversity to learn more about indicators and trading tools.
About Ooki
Ooki is a protocol for margin trading, borrowing, lending and staking enabling the building of Decentralized Applications for lenders, borrowers, and traders to interact with the most flexible decentralized finance protocol on multiple blockchains. Ooki is a fully decentralized, community-run DAO, governed by the community vote for all major changes to the protocol. Ooki users can engage in margin trading with up to 15x leverage using a fully decentralized trading platform.