Chart patterns are crucial to every caliber of investor as they show market trends and predict movement. They are essential in performing technical analysis. Traders can use chart patterns to make informed decisions about their cryptocurrency investments.
Market patterns may sometimes contain predictive ability based on the collective experiences of traders. For example, trend lines create recognizable configurations that can signal asset price changes.
Trading psychology is part of the reason these patterns contain predictive ability. As creatures of habit, human beings base their action or reaction on experiences coping with conflict and enacting patterns associated with their successes.
Market patterns occur in several recognizable formats: trend lines, reversal patterns, and continuation patterns. Below is a brief summary of some common chart patterns in each of these categories.
Trend Lines
Trend lines consist of a series of lines or curves drawn on a chart by connecting descending peaks (highs) or ascending troughs (lows) define a trend line in technical market analysis. When price touches support and resistance areas on a price chart it represents a potential opportunity to make a trade. Trend lines fall in the following subcategories:
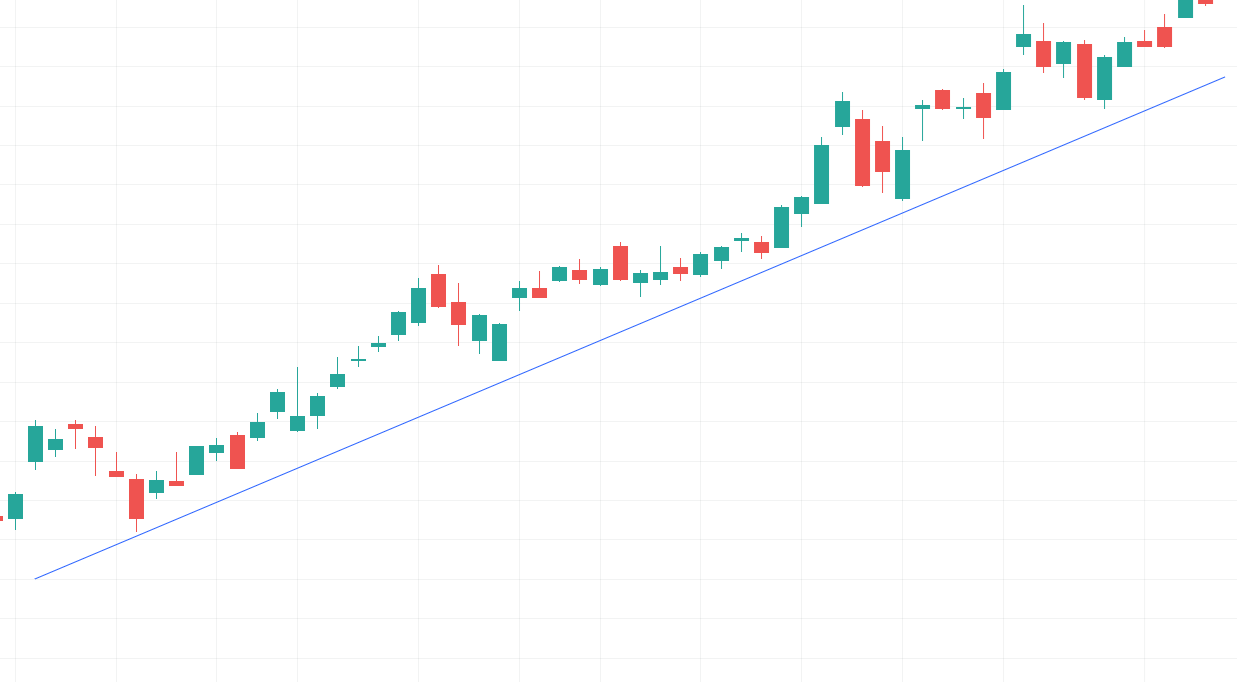
Uptrend Line (potentially BULLISH)
Users can identify uptrend lines by forming a positive slope from connecting two or more low points; the succeeding low must be higher than the preceding low for the line to have a positive slope. At least three points must connect to verify the uptrend.
Uptrend lines act as support and signify rising demand (net) amidst increasing prices. A combination of growing demand and prices is bullish, indicative of willing buyers. The uptrend remains intact if the asset price remains above the trend; a break or fall below indicates a weakening net demand and a potential change.
Downtrend Line (potentially BEARISH)
Downtrend lines act as resistance and suggest net supply growth despite the price decline. They have a negative slope when connecting two or more high points. Like the upward trend, validating the downtrend line requires at least three points.
A decreasing price combined with increasing supply shows a resolve by market sellers; maintaining the position keeps the downtrend line intact. A break above the downtrend suggests a change in seller attitude, showing a decreasing net supply.

Continuation Patterns
A continuation pattern occurs within a trend, showing a trend progression; it denotes a consolidation period amidst a trend. Continuation patterns include:
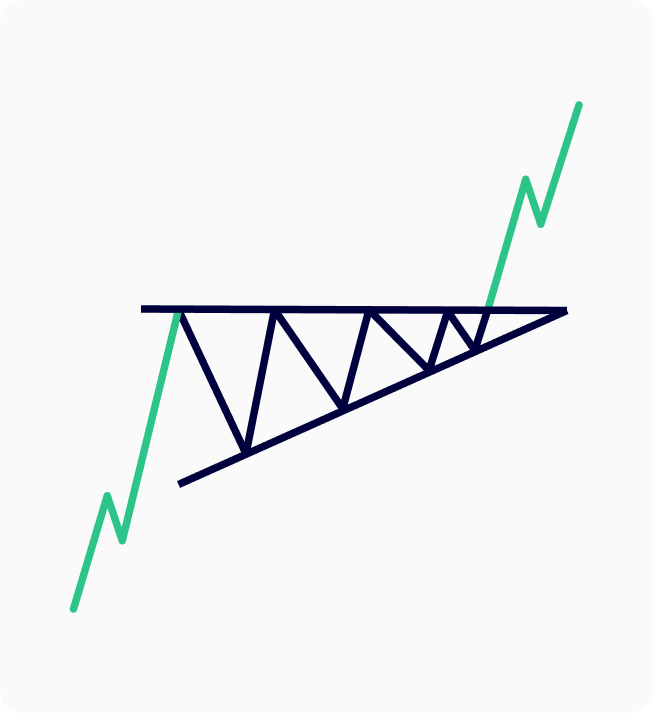
Ascending Triangle (potentially BULLISH)
They form when connecting the resistance line with the uptrend line. Traders draw the pattern by placing the horizontal line (resistance) on the resistance points and tracing the ascending (uptrend) line along with the support point. Ascending triangles are bullish and signify an imminent breakout upon the triangle line convergence.
Descending Triangle (potentially BEARISH)
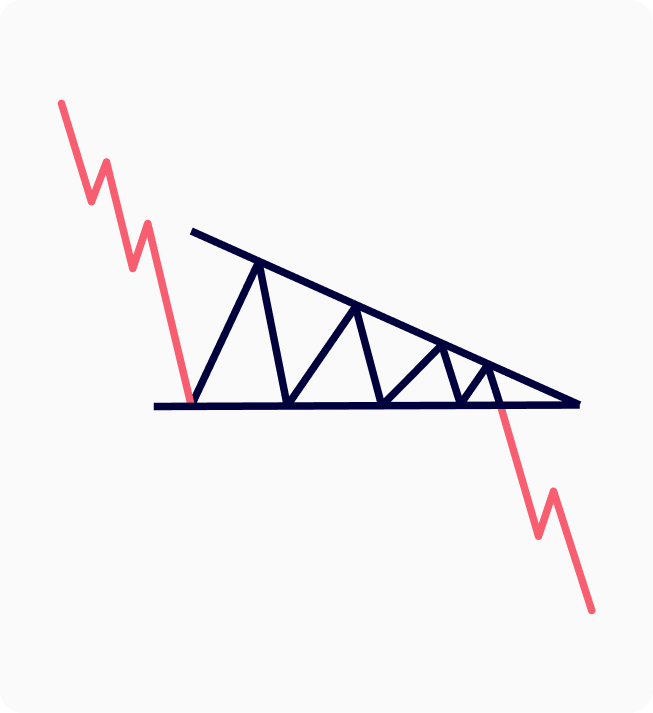
Descending triangles denote a bearish market downtrend. The resistance line is descending while the support line remains horizontal, indicating the possibility of a downward breakout once the two lines converge.
Falling Wedge (potentially BULLISH)
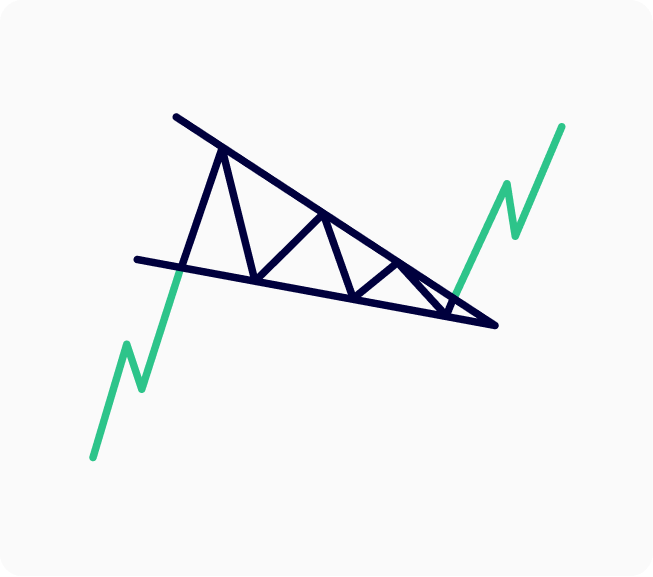
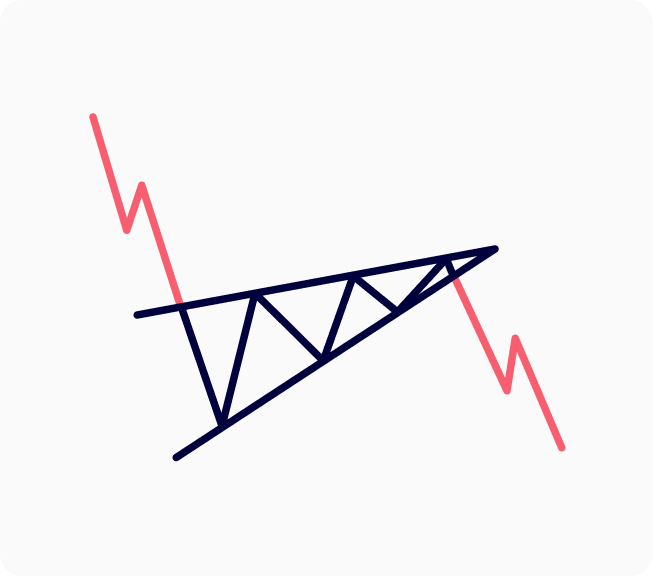
Two converging lines (uptrend or downtrend) define wedges. They represent a tightening price movement between the support and resistance lines as rising or falling wedges. The wedge lacks a horizontal trend line; it forms from two upward or downward trend lines.
A falling wedge represents a break during an uptrend; a rising trend shows a pause in a falling market. Like flags, the volume gradually declines during wedge formation and recovers once the asset price breaks above or below the wedge patterns.
Rising Wedge (potentially BEARISH)
The rising (ascending) wedge pattern is a bearish chart pattern that signals an imminent breakout to the downside.
Flags
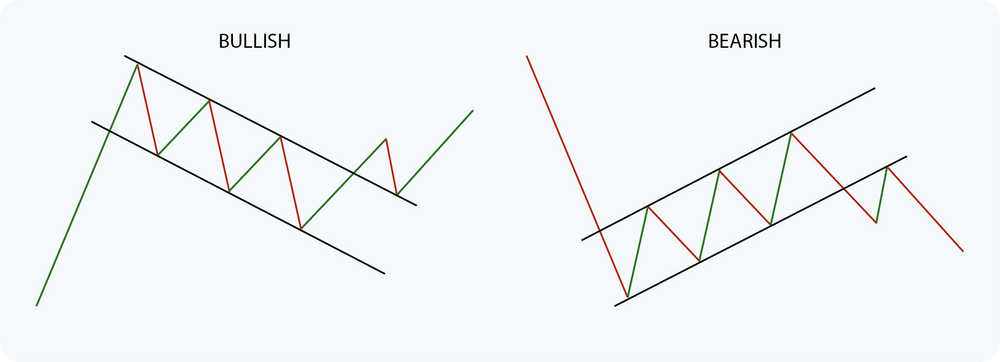
The support and resistance lines run parallel in the flag stock chart pattern, which resembles a slopping rectangle. An upward slope flag (bullish) shows a break in a down-trending market, whereas a downward slope flag denotes a pause during a market uptrend (bearish). A declining volume period accompanies flag formation, which recovers as the asset price breaks from the flag formation.
Reversal Patterns
Reversal patterns indicate a change from the prevailing market trend; they signify a period where market participants have run out of steam. Energy from bulls or bears will guide the market in a new direction following a reversal pattern. They include:
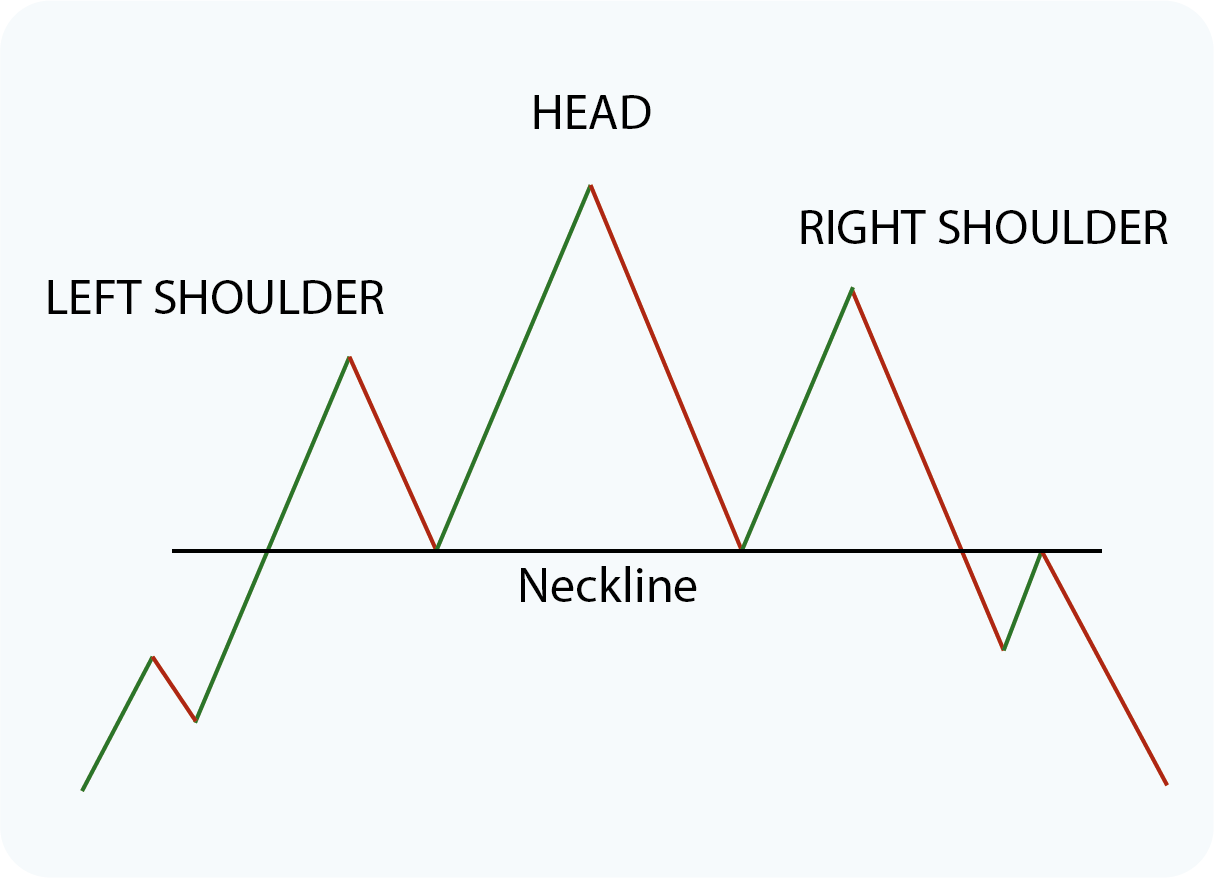
Head and Shoulders (potentially BEARISH)
A peak (head) and two smaller peaks on either side define the head and shoulders pattern; these are two smaller price movements surrounding one bigger change. All three levels fall back to the same support level (neckline) before the trend breaks.
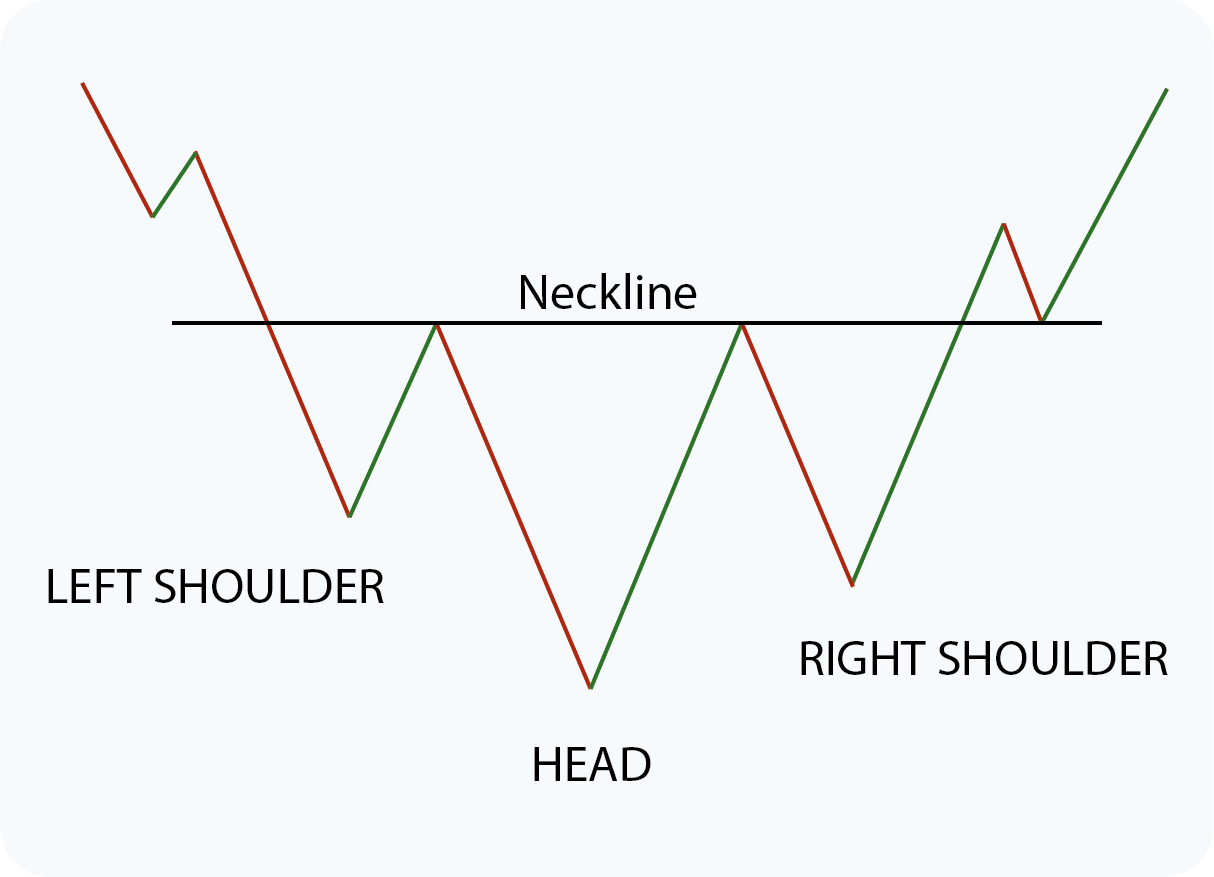
Inverse Head and Shoulders (potentially BULLISH)
IH&S patterns create when the price meets the following characteristics: the price falls and then rises; the price falls below the former trough and then rises again; finally, the price drops again but not as far as the second trough. After the final formation, the price heads up toward the resistance.
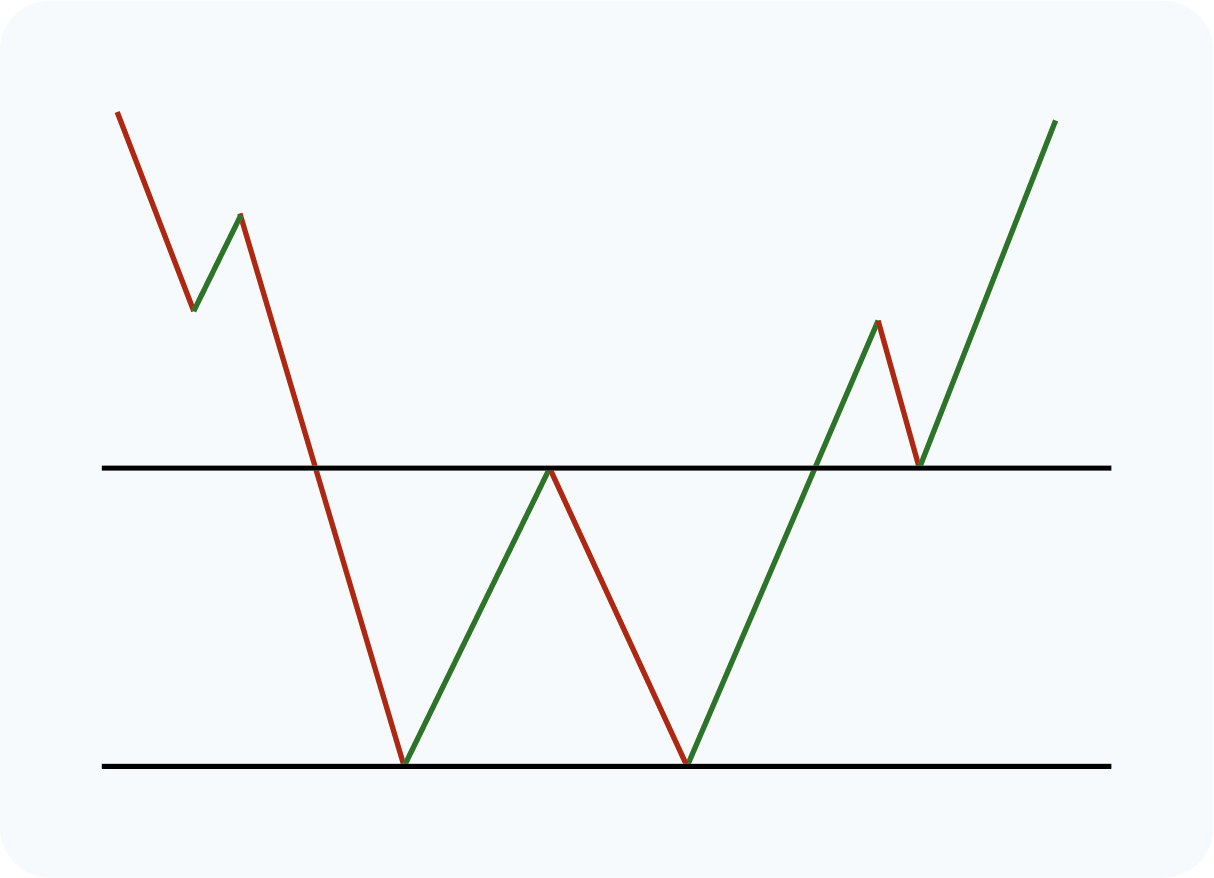
Double bottom (potentially BULLISH)
A double bottom represents the letter W, indicating two unsuccessful attempts at the price to break through the support level. The result is a reversal in the prevailing market trend.
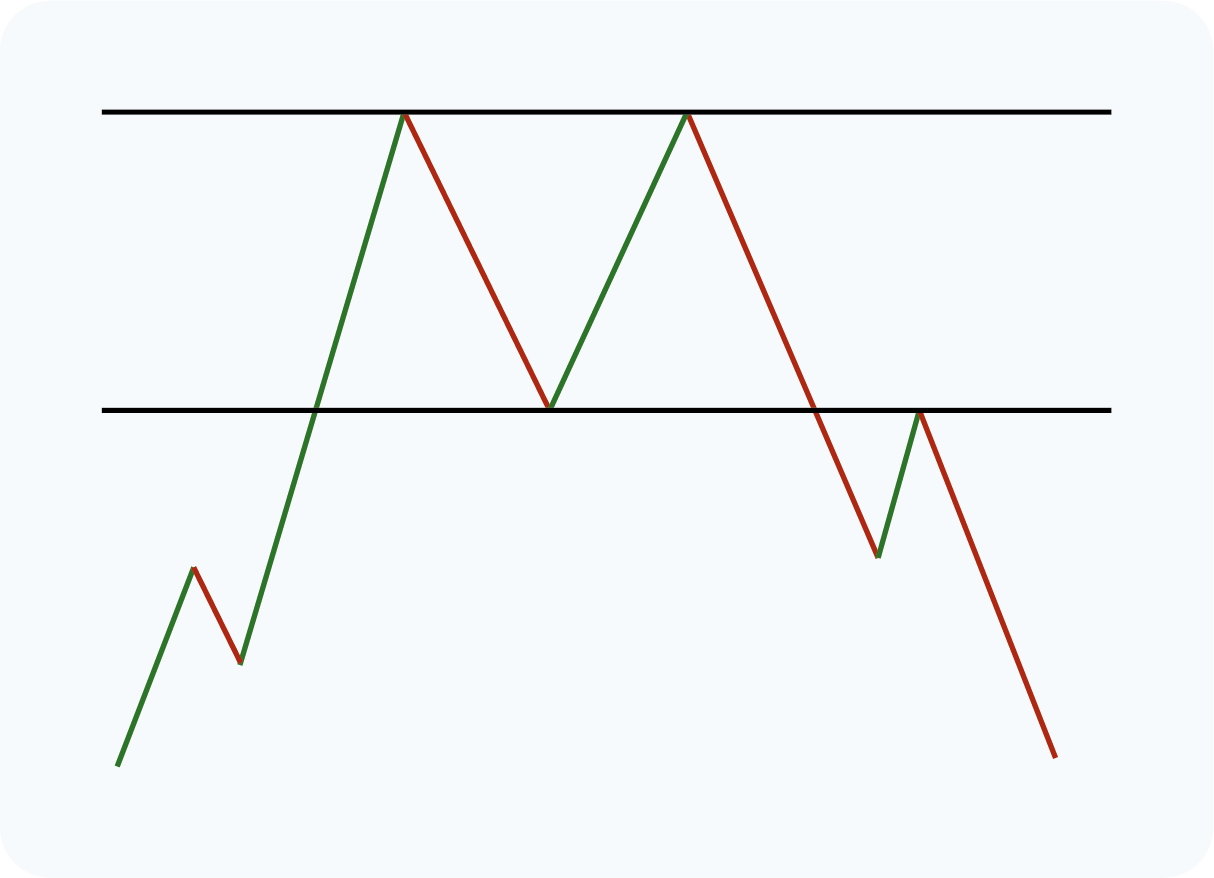
Double Top (potentially BEARISH)
Shaped like the letter M, the pattern highlights two unsuccessful attempts to break through the resistance level; therefore, a trend reversal occurs.
Neutral Patterns
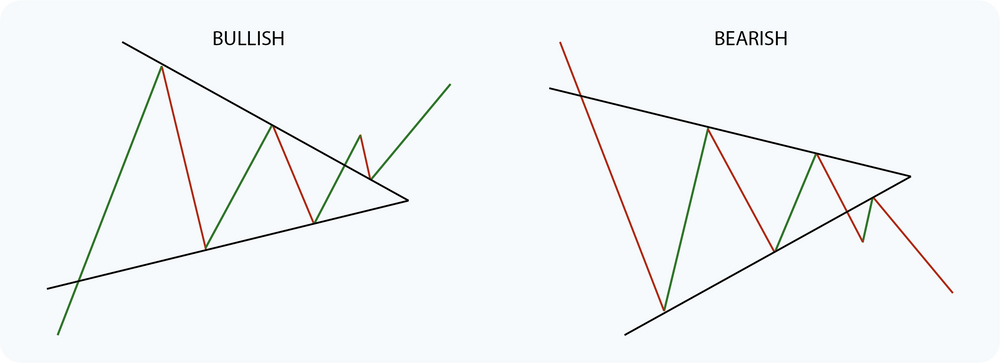
Symmetrical Triangle
A triangle pattern forms when the uptrend and downtrend lines converge, implying a breakout in either direction, but it often follows the general market trend.
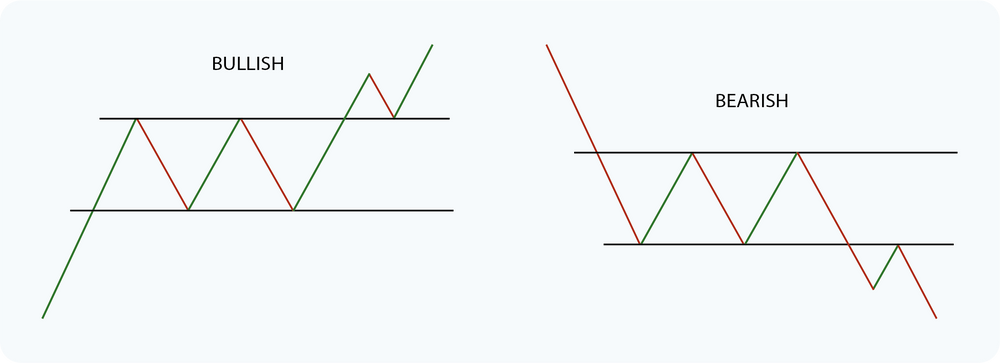
Rectangle
Occurs when the asset price moves between horizontal support and resistance levels, indicating no trend. The rectangle ends when there is a breakout, and the price moves beyond the defined lines.
Patterns are a Guide, Not a Certainty
Despite the extensive research defining chart patterns, market outcomes often deviate from the expectations or predictions. For context, the moving average convergence/divergence (MACD) indicator is 49% accurate in predicting the price movement of a random stock. These deviations from technical predictions keep traders actively monitoring the market as the changes maintain the market's unpredictability.
About Ooki
Ooki is a protocol for margin trading, borrowing, lending and staking enabling the building of Decentralized Applications for lenders, borrowers, and traders to interact with the most flexible decentralized finance protocol on multiple blockchains. Ooki is a fully decentralized, community-run DAO, governed by the community vote for all major changes to the protocol. Ooki users can engage in margin trading with up to 15x leverage using a fully decentralized trading platform.
