

What is Technical Analysis?
Technical Analysis (TA) is a market analysis strategy that can be used in order to assist traders in identify potential trading opportunities. A trader utilizing TA strategies will typically analyze statistical trends gathered from historical asset prices.
Chart Indicators
Chart indicators are a specific subset of TA used for performing market analysis. Chart indicators can be applied to price charts and provide traders with additional data used to make trading decisions.
There are thousands of chart indicators available which use a variety of data in order to give traders insights into future price movements. The Ookiversity chart indicator series will focus on some of the more popular indicators.
In this week's article we are focusing on Fibonacci Retracements.
Fibonacci Retracements
The Fibonacci sequence is a mathematical series of numbers where each number is the sum of the two preceding ones, usually starting with 0 and 1: 0, 1, 1, 2, 3, 5, 8, 13, and so on. Leonardo Fibonacci, an Italian mathematician of the 13th century, introduced this sequence to Western mathematics, but its occurrence can be traced back to ancient Indian mathematics.
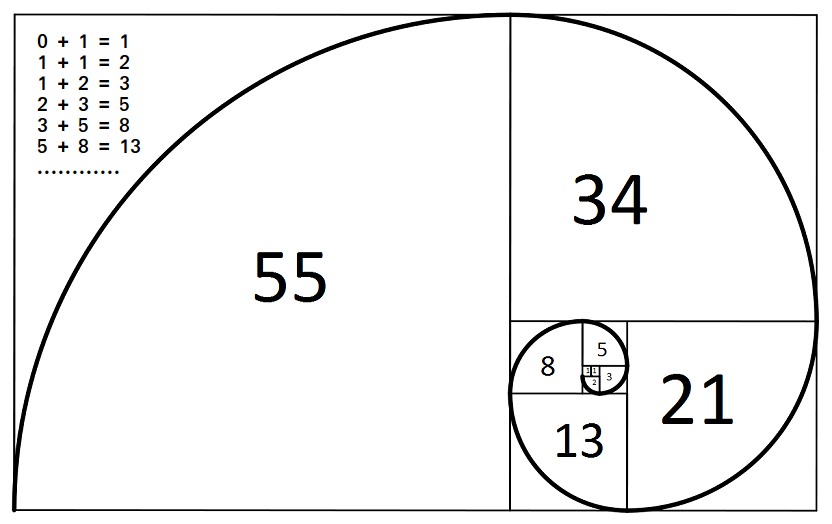
Fibonacci stumbled upon this sequence while contemplating a problem related to rabbit population growth. The problem posed was: beginning with a single pair of rabbits (one male and one female), if every month each productive pair bears a new pair, which begins to produce from the second month on, how many pairs of rabbits will there be at the end of a certain number of months?
In solving this problem, the sequence emerged. He soon realized that this sequence was not just about counting rabbits. The Fibonacci sequence was evident in various natural phenomena, such as the branching of trees, the arrangement of leaves on a stem, and even the pattern of the florets of a flower.
This pattern led to the discovery of the 'Golden Ratio' (approximately 1.6180339887), known by the Greek letter Phi (Φ). When you divide one number in the sequence by the number before it, the ratios oscillate and converge around this Golden Ratio. For instance, 5/3 = 1.666... and 13/8 = 1.625.
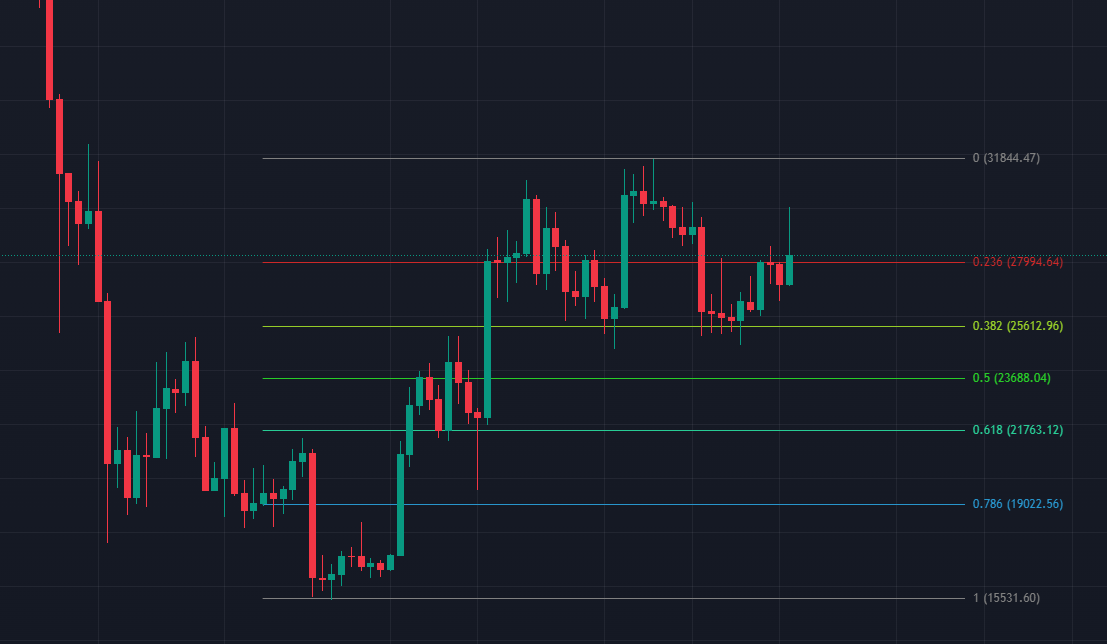
In the realm of financial markets, the logic behind applying Fibonacci retracements is rooted in the belief that markets, to some extent, move in predictable patterns due to human psychology and herd behavior. If the market has moved in a certain direction, it's not uncommon for it to retrace or reverse in an order that's in harmony with the Fibonacci sequence. By plotting a trend line between a significant high and low, and then dividing this distance by particular Fibonacci ratios: 23.6%, 38.2%, 50%, 61.8%, and 100%, traders aim to predict potential price reversals. The logic is that these levels might be areas where a lot of traders make decisions, thereby creating potential support or resistance.
How to use Fibonacci Retracements in Trading Strategies
- Spotting Support and Resistance: Traders look for potential buy or sell entries when an asset's price approaches a Fibonacci retracement level. If a stock, amidst an upward trend, retracts close to the 38.2% retracement level, it may be viewed as a potential buying opportunity, with expectations for the stock to resume its upward trajectory.
- Determining Stop-Loss Points: Fibonacci retracement levels can also guide stop-loss orders. For example, if a trader's buying point is near the 50% level, a stop-loss just below the 61.8% level could be set. The rationale is that a retracement beyond this point may suggest a potential trend reversal.
- Setting Profit Targets: Extension levels like 161.8%, 261.8%, and even 423.6% serve as possible exit or profit-taking points. These projections, beyond the 100% retracement, anticipate where a price might move post a robust breakout.
- Synchronizing with Other Indicators: The potency of Fibonacci retracements amplifies when amalgamated with other indicators. For instance, if a 50% retracement level also coincides with a significant moving average or an erstwhile resistance turned support, the relevance of the retracement level becomes more pronounced.
- Appreciating Market Sentiment: The efficacy of Fibonacci retracements often owes to a multitude of traders respecting these levels. When a vast number of traders monitor identical Fibonacci levels and set buy or sell orders around these regions, it often materializes as a self-fulfilling prophecy.
Conclusion
It's crucial to remember that while Fibonacci retracements are invaluable, they should never be used in isolation. An inclusive trading strategy usually integrates various indicators, market news analysis, and other pertinent data before finalizing trade decisions. Use the Ookiversity to learn more about indicators and trading tools.
About Ooki
Ooki is a protocol for margin trading, borrowing, lending and staking enabling the building of Decentralized Applications for lenders, borrowers, and traders to interact with the most flexible decentralized finance protocol on multiple blockchains. Ooki is a fully decentralized, community-run DAO, governed by the community vote for all major changes to the protocol. Ooki users can engage in margin trading with up to 15x leverage using a fully decentralized trading platform.