What is Technical Analysis?
Technical Analysis (TA) is a strategic approach to market analysis, aiding traders and investors in identifying potential trading and investment opportunities. It involves the study of historical market data, primarily price and volume, to forecast future market behavior.
Tools and Concepts in Technical Analysis
Within the domain of Technical Analysis, there exists a spectrum of tools that provide the structural foundation for market forecasting.
These instruments range from chart patterns to price level calculations, each offering a unique perspective on potential market movements. These tools are indispensable in a trader's toolkit, serving as navigational beacons in the often unpredictable waters of market analysis. They stand apart from complex theories, offering straightforward, data-driven insights that are pivotal for daily trading decisions.
In this week's article we are focusing on Pivot Points.
Pivot Points
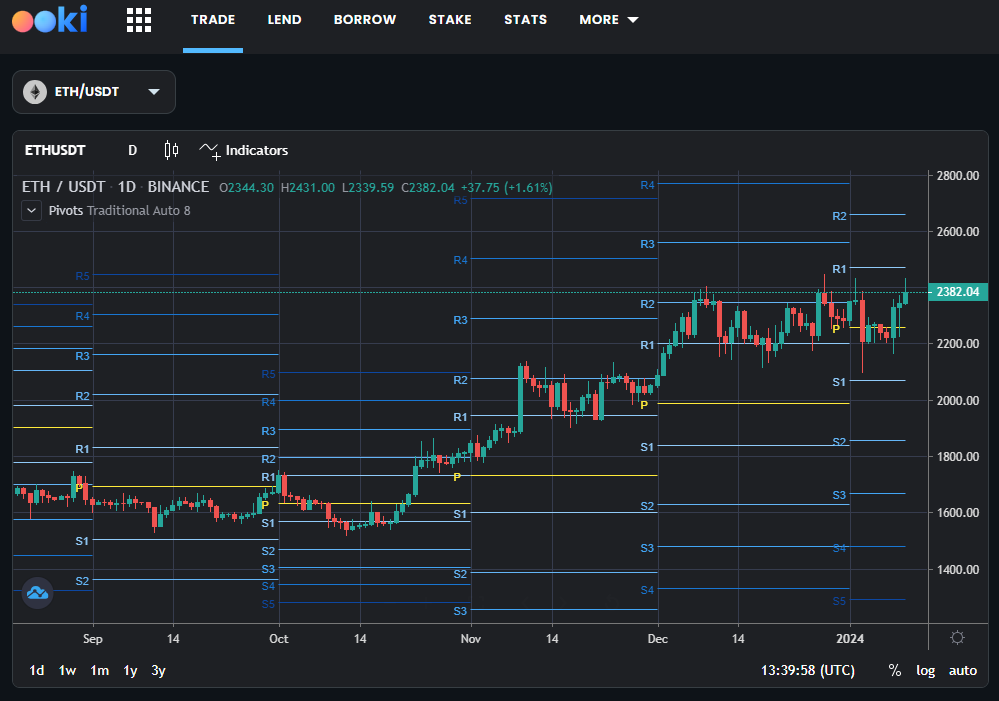
Pivot Points stand as a premier technical analysis tool, employed by traders to discern critical support and resistance levels. Pioneered from the floor trading days, pivot points represent a calculation based on the high, low, and closing prices of the previous trading day. The central pivot point, alongside its higher and lower levels known as support and resistance, provides a snapshot of potential turning points in price movement for the current trading session.
Traders often plot these points on their charts as horizontal lines to visualize potential areas where the price is likely to encounter substantial resistance or support. These levels become a scale of sentiment, with price movements towards pivot points potentially signaling shifts in market dynamics. The simplicity of pivot points lies in their forward-looking focus, as they provide actionable information for the current session, unlike many indicators that are more reflective of past market activity.

How to Use Pivot Points in Trading Strategies
Pivot Points serve as a foundation for a wide array of trading strategies. Here's how traders can utilize them effectively:
- Determining Market Sentiment: Pivot points can help traders gauge the general market sentiment. Trading above the central pivot point may indicate a bullish sentiment, while trading below it suggests bearish sentiment.
- Precision Entry and Exit Points: The support and resistance levels offered by pivot points can inform precise entry and exit points for trades. For instance, a trader might enter a position near a support level and exit near a resistance level.
- Stop-Loss Placement: The support and resistance levels can also aid in placing stop-loss orders. A stop-loss might be set just below a support level for a long position or above a resistance level for a short position.
- Breakout and Reversal Signals: Significant breaches of pivot points can signal potential breakouts or reversals. A price move through a pivot level may indicate strength or weakness in the asset and can lead to a new trend formation.
Pivot Points are uniquely beneficial for their predictive nature and their ability to offer quick, clear levels of interest. When incorporated into a daily trading routine, they provide a structured approach to market entry and exit, bolstered by the historical price data that underpins their calculation. As with all technical tools, the use of pivot points is most effective when combined with other indicators and market analysis methods to confirm signals.
Use the Ookiversity to learn more about indicators and trading tools.
About Ooki
Ooki is a protocol for margin trading, borrowing, lending and staking enabling the building of Decentralized Applications for lenders, borrowers, and traders to interact with the most flexible decentralized finance protocol on multiple blockchains. Ooki is a fully decentralized, community-run DAO, governed by the community vote for all major changes to the protocol. Ooki users can engage in margin trading with up to 15x leverage using a fully decentralized trading platform.


