What is Technical Analysis?
Technical Analysis (TA) is a market analysis strategy that can be used in order to assist traders in identify potential trading opportunities. A trader utilizing TA strategies will typically analyze statistical trends gathered from historical asset prices.
Chart Indicators
Chart indicators are a specific subset of TA used for performing market analysis. Chart indicators can be applied to price charts and provide traders with additional data used to make trading decisions.
There are thousands of chart indicators available which use a variety of data in order to give traders insights into future price movements. The Ookiversity chart indicator series will focus on some of the more popular indicators.
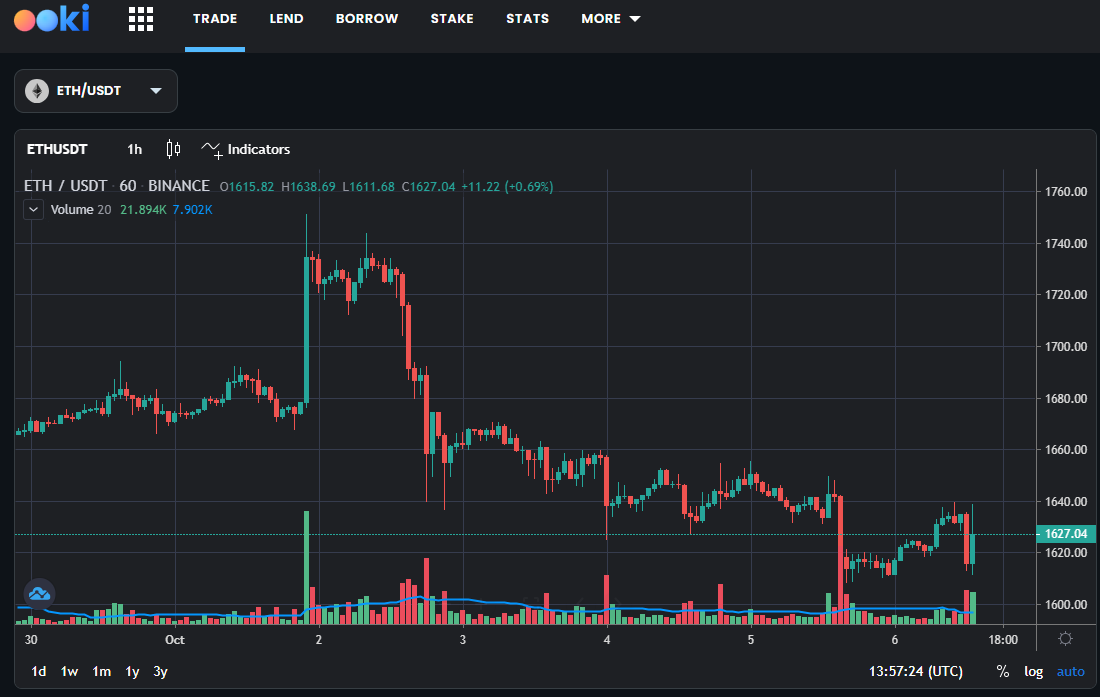
In this week's article we are focusing on Volume.
Volume
Volume is one of the most foundational elements in technical analysis, commonly employed by traders and investors to interpret market activity. By definition, volume represents the total number of shares, contracts, or lots traded for a particular asset within a given time frame. This time frame could be as short as one minute or as long as one year, depending on the chart. Volume is often displayed as a series of vertical bars at the bottom of a trading chart, with each bar corresponding to a specific time frame.
The Importance of Volume
Volume serves as a measure of the strength or weakness of market sentiment around a specific asset. High volume generally indicates strong interest and typically accompanies significant price movements, either upward or downward. Conversely, low volume suggests a lack of interest and is often correlated with a relatively flat price movement.
Types of Volume
- Transaction Volume: The most straightforward, representing the total number of transactions completed during a particular time frame.
- Tick Volume: Reflects the number of price changes in the asset, which can serve as a proxy for transaction volume in markets where actual transaction data isn't available.
- Money Flow Volume: Takes into account not only the number of shares traded but also whether the asset was generally being accumulated (bought) or distributed (sold).
Volume and Market Phases
- Accumulation Phase: Higher-than-average volume indicates that "smart money" or institutional investors are buying into the position.
- Markup Phase: Continued high volume shows strong retail interest, driving the price upward.
- Distribution Phase: Volume spikes as institutional investors begin to sell, often marking a top.
- Decline Phase: Decreased volume indicates lessening interest, usually leading to falling prices.
How to use Volume in Trading Strategies
Using volume effectively in trading strategies involves more than just observing whether volume bars are high or low. Here are some key strategies and tips on how to use volume in trading:
- Confirming Trends
One of the most common uses of volume is to confirm trends. A rising price coupled with increasing volume is generally a solid indication of an upward trend, while a falling price along with decreasing volume is often a sign of a downward trend. - Identifying Reversals
Volume can also be useful in spotting potential reversals. A sudden surge in volume can indicate the start of a new trend, as it reflects a strong consensus among traders that the asset is either overbought or oversold. - Volume Breakouts
When an asset moves out of a trading range on high volume, it's often an indication that it will continue to move in that direction. This strategy is called a volume breakout. - Using Volume with Other Indicators
Many traders use volume in conjunction with other technical indicators like moving averages or Bollinger Bands. For example, a moving average crossover accompanied by high volume is often considered a stronger signal than one that occurs with low volume.
Volume and Risk Management
Incorporating volume into your trading can also assist in risk management. High volume levels can confirm the validity of stop losses or other exit strategies, providing an extra layer of confirmation.
Conclusion
Understanding volume is crucial for any trader, regardless of the market or asset class. By paying close attention to volume and incorporating it into a holistic trading strategy, traders can make more informed decisions and better manage risk.
Indicators alone, however, are largely useless. In principle, other techniques should also be included in trading, such as candlestick analysis.
About Ooki
Ooki is a protocol for margin trading, borrowing, lending and staking enabling the building of Decentralized Applications for lenders, borrowers, and traders to interact with the most flexible decentralized finance protocol on multiple blockchains. Ooki is a fully decentralized, community-run DAO, governed by the community vote for all major changes to the protocol. Ooki users can engage in margin trading with up to 15x leverage using a fully decentralized trading platform.