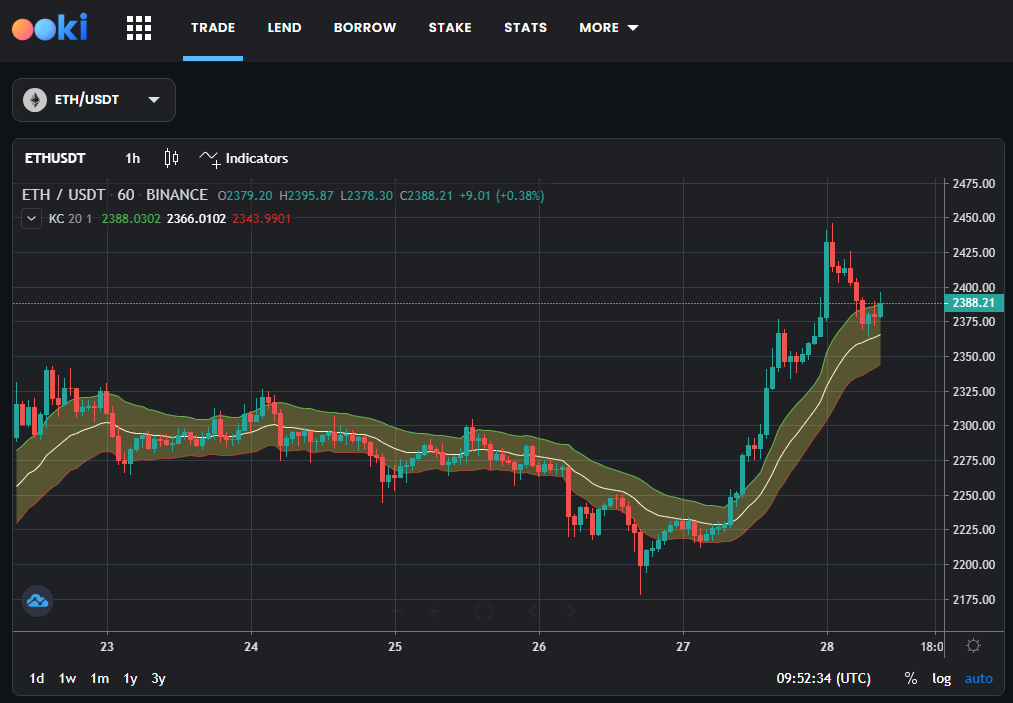
What is Technical Analysis?
Technical Analysis (TA) is a strategic approach to market analysis, aiding traders and investors in identifying potential trading and investment opportunities. It involves the study of historical market data, primarily price and volume, to forecast future market behavior.
Chart Indicators
Chart indicators are a specific subset of TA used for performing market analysis. Chart indicators can be applied to price charts and provide traders with additional data used to make trading decisions.
There are thousands of chart indicators available which use a variety of data in order to give traders insights into future price movements. The Ookiversity chart indicator series will focus on some of the more popular indicators.
In this week's article we are focusing on Keltner Channels.
Keltner Channels
Keltner Channels are a type of volatility-based envelope set above and below an exponential moving average (EMA), developed by Chester W. Keltner. The channels are typically used to identify potential reversals by comparing the current price to the channel’s boundaries, which are based on the Average True Range (ATR).
The central line of the Keltner Channel is the EMA (white), which reflects the average price over a specified period. The upper (green) and lower (red) bounds are set a fixed multiple of the ATR above and below the EMA. This creates a band that can adapt to changes in volatility; the channel widens during periods of high volatility and narrows during low volatility.
Traders often look for the price breaking out of the Keltner Channel as an indicator of a potential trend starting. When the price closes back inside the channel, it may signal the end of the trend or a pause in the trend.

How to Use Keltner Channels in Trading Strategies
Keltner Channels can be a valuable addition to a trader's toolkit. Here’s how they can be integrated into trading strategies:
- Trend Confirmation: A move above the upper channel may indicate the start of an uptrend, while a move below the lower channel may signal the beginning of a downtrend.
- Breakouts and Exits: Traders might enter a position when the price breaks out of the channel and exit when the price moves back within the channel bounds.
- Overbought and Oversold Conditions: Some traders interpret a move towards the upper channel as overbought and a move towards the lower channel as oversold, potentially foreshadowing a reversal.
- Volatility Assessment: The width of the Keltner Channels can help traders assess the volatility of the market. A wider channel indicates higher volatility, which may affect the trader's risk management decisions.
- Combination with Other Indicators: To filter signals and improve accuracy, traders may use Keltner Channels in conjunction with other indicators, such as the Stochastic Oscillator or the Relative Strength Index (RSI).
In conclusion, Keltner Channels offer traders insights into trend direction, volatility, and potential entry and exit points. By understanding and applying this tool, traders can enhance their analysis and decision-making process in the ever-changing market landscape.
Use the Ookiversity to learn more about indicators and trading tools.
About Ooki
Ooki is a protocol for margin trading, borrowing, lending and staking enabling the building of Decentralized Applications for lenders, borrowers, and traders to interact with the most flexible decentralized finance protocol on multiple blockchains. Ooki is a fully decentralized, community-run DAO, governed by the community vote for all major changes to the protocol. Ooki users can engage in margin trading with up to 15x leverage using a fully decentralized trading platform.


